In digital hardware, numbers are stored in binary words. A binary word is a fixed-length sequence of bits (1's and 0's). The data type defines how hardware components or software functions interpret this sequence of 1's and 0's. Numbers are represented as either scaled integer (usually referred to as fixed-point) or floating-point data types.
Most pretrained neural networks and neural networks trained using Deep Learning Toolbox™ use single-precision floating point data types. Even small trained neural networks require a considerable amount of memory, and require hardware that can perform floating-point arithmetic. These restrictions can inhibit deployment of deep learning capabilities to low-power microcontrollers and FPGAs.
Using the Deep Learning Toolbox Model Quantization Library support package, you can quantize a network to use 8-bit scaled integer data types.
Quantization of a neural network requires a GPU, the GPU Coder™ Interface for Deep Learning Libraries support package, and the Deep Learning Toolbox Model Quantization Library support package. Using a GPU requires a CUDA® enabled NVIDIA® GPU with compute capability 6.1, 6.3 or higher.
Precision and Range
Scaled 8-bit integer data types have limited precision and range when compared to single-precision floating point data types. There are several numerical considerations when casting a number from a larger floating-point data type to a smaller data type of fixed length.
-
Precision loss: Precision loss is a rounding error. When precision loss occurs, the value is rounded to the nearest number that is representable by the data type. In the case of a tie it rounds:
-
Positive numbers to the closest representable value in the direction of positive infinity.
-
Negative numbers to the closest representable value in the direction of negative infinity.
In MATLAB® you can perform this type of rounding using the
roundfunction. -
-
Underflow: Underflow is a type of precision loss. Underflows occur when the value is smaller than the smallest value representable by the data type. When this occurs, the value saturates to zero.
-
Overflow: When a value is larger than the largest value that a data type can represent, an overflow occurs. When an overflow occurs, the value saturates to the largest value representable by the data type.
Histograms of Dynamic Ranges
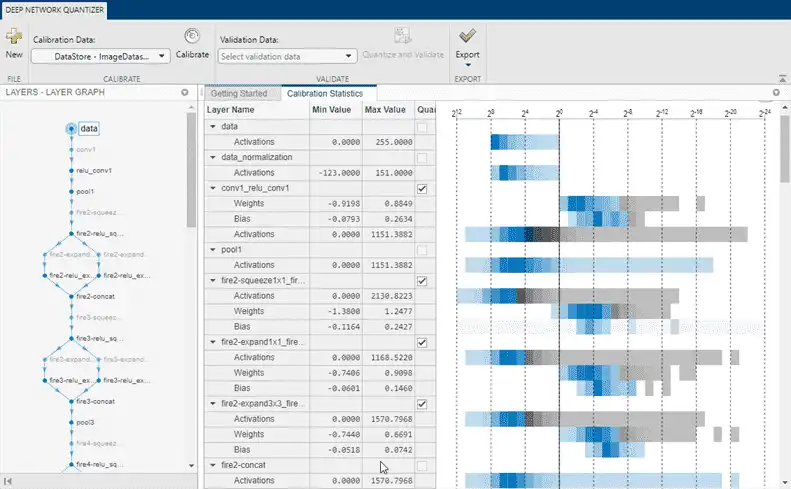
Use the Deep Network Quantizer app to collect and visualize the dynamic ranges of the weights and biases of the convolution layers and fully connected layers of a network, and the activations of all layers in the network. The app assigns a scaled 8-bit integer data type for the weights, biases, and activations of the convolution layers of the network. The app displays a histogram of the dynamic range for each of these parameters. The following steps describe how these histograms are produced.
-
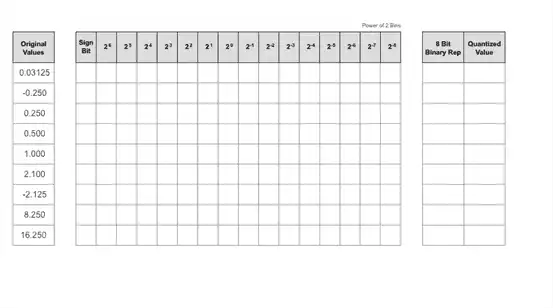
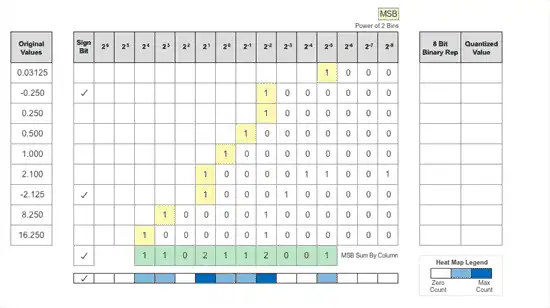
For example, to begin, consider the following values logged for a parameter while exercising a network.
-
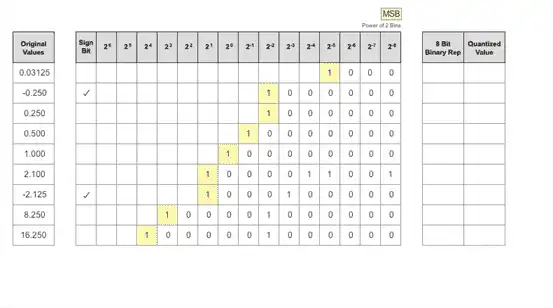
Find the ideal binary representation of each logged value of the parameter.
The most significant bit (MSB) is the left-most bit of the binary word. This bit contributes most to the value of the number. The MSB for each value is highlighted in yellow.
-
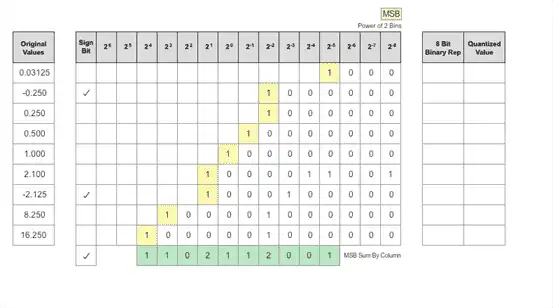
By aligning the binary words, you can see the distribution of bits used by the logged values of a parameter. Sum the number of MSB's in each column for an aggregate view of the logged values.
-
Display the MSB counts of each bit location as a heat map. In this heat map, darker blue regions correspond to a larger number of MSB's in the bit location.
-
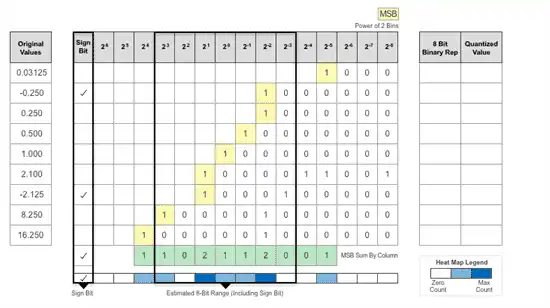
The software assigns a data type that can represent the bit locations that capture the most information. In this example, the software selects a data type that represents bits from 23 to 2-3. An additional sign bit is required to represent the signedness of the value.
-
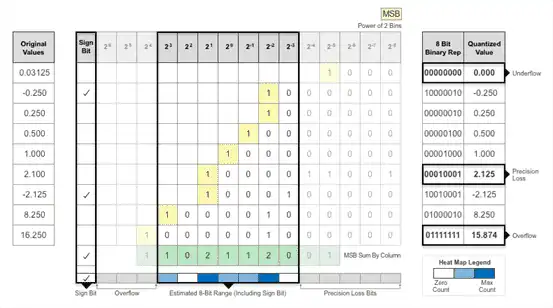
After assigning the data type, any bits outside of that data type are removed. In this sample, the first value, 0.03125, suffers from an underflow, so the quantized value is 0. The ideal value 2.1 suffers some precision loss, so the quantized value is 2.125. The value 16.250 is larger than the largest representable value of the data type, so this value overflows. The quantized value saturates to 15.874.
-
The app displays this heat map histogram for each learnable parameter in the convolution layers and fully connected layers of the network. The gray regions of the histogram show the bits that cannot be represented by the data type.