2-D and 3-D Plots - MATLAB & Simulink

2-D and 3-D Plots


Line Plots

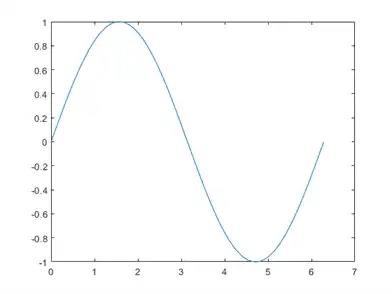
To create two-dimensional line plots, use the plot function. For example, plot the value of the sine function from 0 to 2π:

x = 0:pi/100:2*pi;
y = sin(x);
plot(x,y)

plot

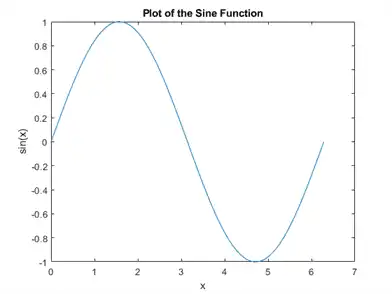
You can label the axes and add a title.

xlabel('x')
ylabel('sin(x)')
title('Plot of the Sine Function')

plot

By adding a third input argument to the plot function, you can plot the same variables using a red dashed line.

plot(x,y,'r--')

plot

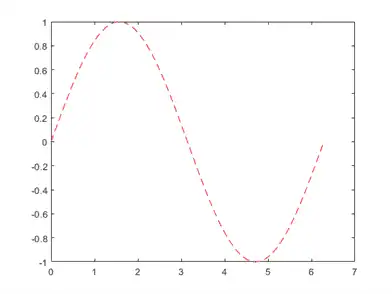
'r--' is a line specification. Each specification can include characters for the line color, style, and marker. A marker is a symbol that appears at each plotted data point, such as a +o, or *. For example, 'g:*' requests a dotted green line with * markers.

Notice that the titles and labels that you defined for the first plot are no longer in the current figure window. By default, MATLAB® clears the figure each time you call a plotting function, resetting the axes and other elements to prepare the new plot.

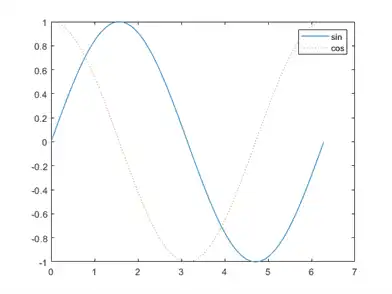
To add plots to an existing figure, use hold on. Until you use hold off or close the window, all plots appear in the current figure window.

x = 0:pi/100:2*pi;
y = sin(x);
plot(x,y)

hold on

y2 = cos(x);
plot(x,y2,':')
legend('sin','cos')

hold off

plot

3-D Plots

Three-dimensional plots typically display a surface defined by a function in two variables, z = f(x,y) .

To evaluate z, first create a set of (x,y) points over the domain of the function using meshgrid.

[X,Y] = meshgrid(-2:.2:2);                                
Z = X .* exp(-X.^2 - Y.^2);

Then, create a surface plot.

surf(X,Y,Z)

plot

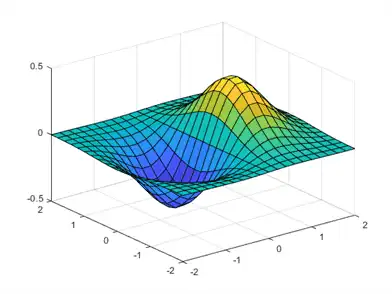
Both the surf function and its companion mesh display surfaces in three dimensions. surf displays both the connecting lines and the faces of the surface in color. mesh produces wireframe surfaces that color only the lines connecting the defining points.
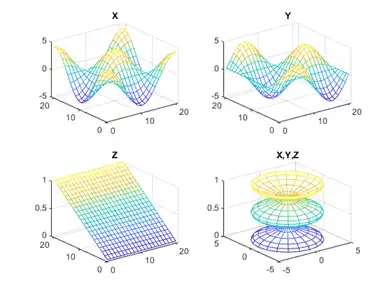
Subplots

You can display multiple plots in different subregions of the same window using the subplot function.

The first two inputs to subplot indicate the number of plots in each row and column. The third input specifies which plot is active. For example, create four plots in a 2-by-2 grid within a figure window.

t = 0:pi/10:2*pi;
[X,Y,Z] = cylinder(4*cos(t));
subplot(2,2,1); mesh(X); title('X');
subplot(2,2,2); mesh(Y); title('Y');
subplot(2,2,3); mesh(Z); title('Z');
subplot(2,2,4); mesh(X,Y,Z); title('X,Y,Z');

plots

Matlabsolutions.com provides guaranteed satisfaction with a commitment to complete the work within time. Combined with our meticulous work ethics and extensive domain experience, We are the ideal partner for all your homework/assignment needs. We pledge to provide 24*7 support to dissolve all your academic doubts. We are composed of 300+ esteemed Matlab and other experts who have been empanelled after extensive research and quality check.

Matlabsolutions.com provides undivided attention to each Matlab assignment order with a methodical approach to solution. Our network span is not restricted to US, UK and Australia rather extends to countries like Singapore, Canada and UAE. Our Matlab assignment help services include Image Processing Assignments, Electrical Engineering Assignments, Matlab homework help, Matlab Research Paper help, Matlab Simulink help. Get your work done at the best price in industry.

Machine Learning in MATLAB

Train Classification Models in Classification Learner App

Train Regression Models in Regression Learner App

Distribution Plots

Explore the Random Number Generation UI

Design of Experiments

Machine Learning Models

Logistic regression

Logistic regression create generalized linear regression model - MATLAB fitglm 2

Support Vector Machines for Binary Classification

Support Vector Machines for Binary Classification 2

Support Vector Machines for Binary Classification 3

Support Vector Machines for Binary Classification 4

Support Vector Machines for Binary Classification 5

Assess Neural Network Classifier Performance

Naive Bayes Classification

ClassificationTree class

Discriminant Analysis Classification

Ensemble classifier

ClassificationTree class 2

Train Generalized Additive Model for Binary Classification

Train Generalized Additive Model for Binary Classification 2

Classification Using Nearest Neighbors

Classification Using Nearest Neighbors 2

Classification Using Nearest Neighbors 3

Classification Using Nearest Neighbors 4

Classification Using Nearest Neighbors 5

Linear Regression

Linear Regression 2

Linear Regression 3

Linear Regression 4

Nonlinear Regression

Nonlinear Regression 2

Visualizing Multivariate Data

Generalized Linear Models

Generalized Linear Models 2

RegressionTree class

RegressionTree class 2

Neural networks

Gaussian Process Regression Models

Gaussian Process Regression Models 2

Understanding Support Vector Machine Regression

Understanding Support Vector Machine Regression 2

RegressionEnsemble