What is difference between stem and plot in MATLAB?

Both plot and stem functions are used to represent a curve in MATLAB. The main point of difference between the two is that plot displays the continuous values for the curve.
Think about drawing a graph of y= sin(x) using a pencil without removing its contact from paper. On the other hand, stem displays the discrete values of the points on the curve.
Think about drawing the graph of y=sin(x) for specific values such as 0,15,30,45,60and 90 degrees respectively. Then join these points from the X-axis. This is the result given by stem.
Try to run this simple code on MATLAB to find the difference yourself.
The output of this code:
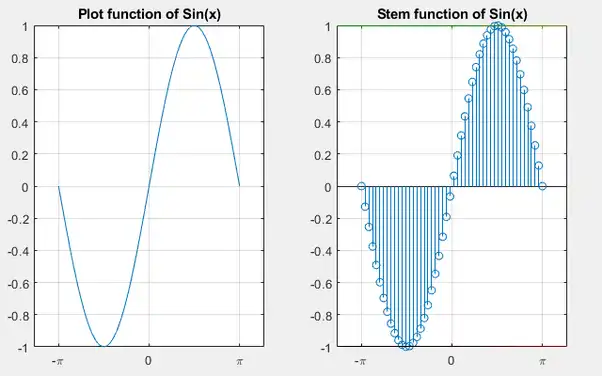
In the code, I’ve used linspace to give the range and the division of values. I’ve used subplot to divide the area of of figure window into 2 equal parts. I’ve also used xticks and xticklabels to change the X-axis from number format to π format. I’ve used other features such as title, grid on to make my curve presentable.
You can clearly see that the curve using plot displays a continuous line while the use of stem results in discrete values marked on the graph.
“I got full marks on my MATLAB assignment! The solution was perfect and delivered well before the deadline. Highly recommended!”
“Quick delivery and excellent communication. The team really understood the problem and provided a great solution. Will use again.”
Explore how MATLAB Solutions has helped clients achieve their academic and research goals through practical, tailored assistance.
The rapid adoption of electric vehicles (EVs) has increased the demand for efficient battery management systems (BMS). As the battery is the primary energy source of an EV, ensuring its safety, performance, and longevity is c
Imagine you are driving an EV. The dashboard screen shows a comforting 15% State of Charge (SOC)plenty of range to reach the next charging station. Then, suddenly, the powertrain loses power and the car shuts down. In the BMS world, this is the ultimate nightmare. It’s the result of i