You can control where data appears in the axes by setting the x-axis, y-axis, and z-axis limits. You also can change where the x-axis and y-axis lines appear (2-D plots only) or reverse the direction of increasing values along each axis.
Change Axis Limits
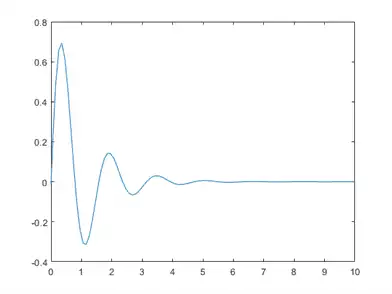
Create a line plot. Specify the axis limits using the xlim and ylim functions. For 3-D plots, use the zlim function. Pass the functions a two-element vector of the form [min max].
x = linspace(-10,10,200);
y = sin (4 * x) ./ exp (x);
plot(x,y)
xlim ([0 10])
ylim ([- 0.4 0.8])
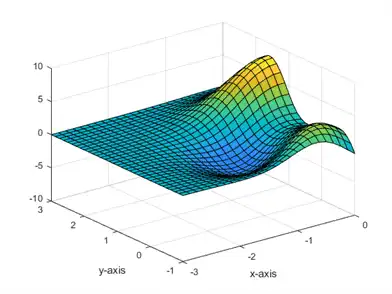
Use Semiautomatic Axis Limits
Set the maximum x-axis limit to 0 and the minimum y-axis limit to -1. Let MATLAB choose the other limits. For an automatically calculated minimum or maximum limit, use -inf or inf, respectively.
[X,Y,Z] = peaks;
surf (X, Y, Z)
xlabel('x-axis')
ylabel('y-axis')
xlim ([- inf 0])
ylim ([- 1 inf])
Revert Back to Default Limits
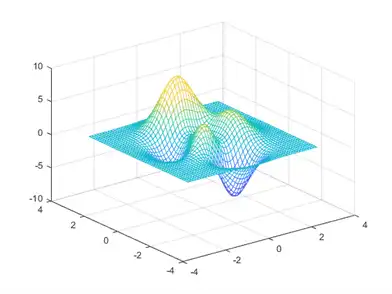
Create a mesh plot and change the axis limits. Then revert back to the default limits.
[X,Y,Z] = peaks;
mesh(X,Y,Z)
xlim ([- 2 2])
ylim ([- 2 2])
evil ([- 5 5])
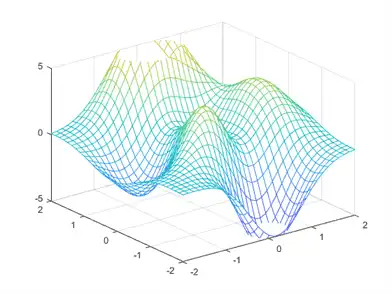
xlim car
ylim car
evil car
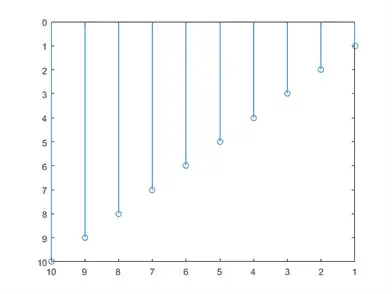
Reverse Axis Direction
Control the direction of increasing values along the x-axis and y-axis by setting the XDir and YDir properties of the Axes object. Set these properties to either 'reverse' or 'normal' (the default). Use the gca command to access the Axes object.
stem(1:10)
ax = gca;
ax.XDir = 'reverse';
ax.YDir = 'reverse';
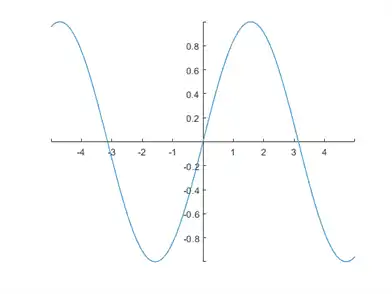
Display Axis Lines through Origin
By default, the x-axis and y-axis appear along the outer bounds of the axes. Change the location of the axis lines so that they cross at the origin point (0,0) by setting the XAxisLocation and YAxisLocation properties of the Axes object. Set XAxisLocation to either 'top', 'bottom', or 'origin'. Set YAxisLocation to either 'left', 'right', or 'origin'. These properties only apply to axes in a 2-D view.
x = linspace(-5,5);
y = sin (x);
plot(x,y)

ax = gca;
ax.XAxisLocation = 'origin';
ax.YAxisLocation = 'origin';
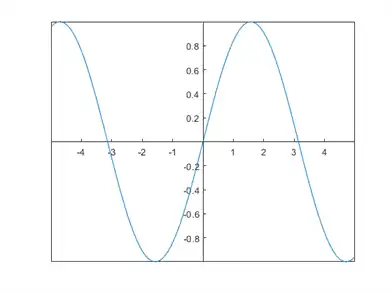
Remove the axes box outline.
box off