Here is an example for the sinus function:
x = linspace(0,2*pi,100);
y = sin(x);
figure; plot(x, y);
The first line means that x is a vector of 100 values between 0 and 2 pi
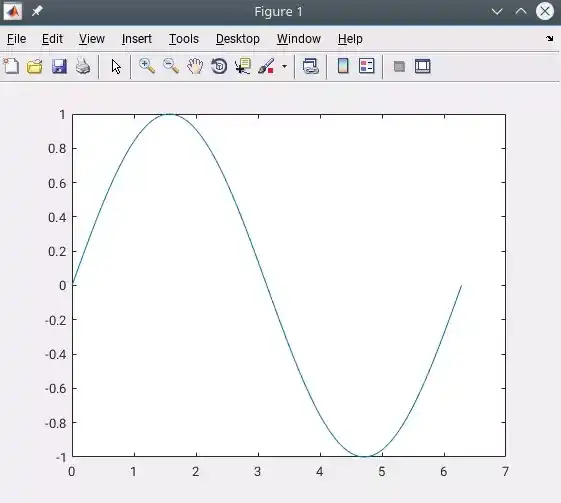
plot will give you the following graph :
Here is an example for the sinus function:
x = linspace(0,2*pi,100); y = sin(x); figure; plot(x, y);
The first line means that x is a vector of 100 values between 0 and 2 pi
plot will give you the following graph :