Harper asked . 2020-12-28

Finding points of signal

I have some data labelled x_v[n] and I am trying to locate the starting and ending points of the peaks from my data.
Till now I obtained x_v[n] and then I performed template matching.
I require to find the starting and ending points of the peaks on x_v[n] Any idea as to how I can do that please?
Here is my code till now:
 
fs = 256;                          
N = length(EOG_Data);             
T = 1/fs;                         
Time = [0:(N - 1)] * T;         

figure();
plot(Time, EOG_Data);
title('x_v[n]');

[pks, locs] = findpeaks(R, 'MinPeakHeight',10e6); %finding peaks
figure();
plot(Time, R); 
hold on;
plot(EOG_Time(locs), pks, '*r') 
hold off;

matlab , signal , signal processing

Expert Answer

John Michell answered . 2024-05-17 18:59:20

Well you could start at a peak and go forward and backward until the signal begins to turn upward.
Or you could just use the widths returned by findpeaks(), which is about half way up. I have a demo for this:
 
clc;    % Clear the command window.
close all;  % Close all figures (except those of imtool.)
clear;  % Erase all existing variables. Or clearvars if you want.
workspace;  % Make sure the workspace panel is showing.
format long g;
format compact;
fontSize = 22;
fprintf('Beginning to run %s.m ...\n', mfilename);

EOG_Data = load('EOG_Data.mat');
EOG_Data_v = double(EOG_Data.EOG_Data_4ch(1,:)) - double(EOG_Data.EOG_Data_4ch(2,:));

fs = 256;
N = length(EOG_Data_v);
T = 1/fs;
EOG_Time = [0:(N - 1)] * T;
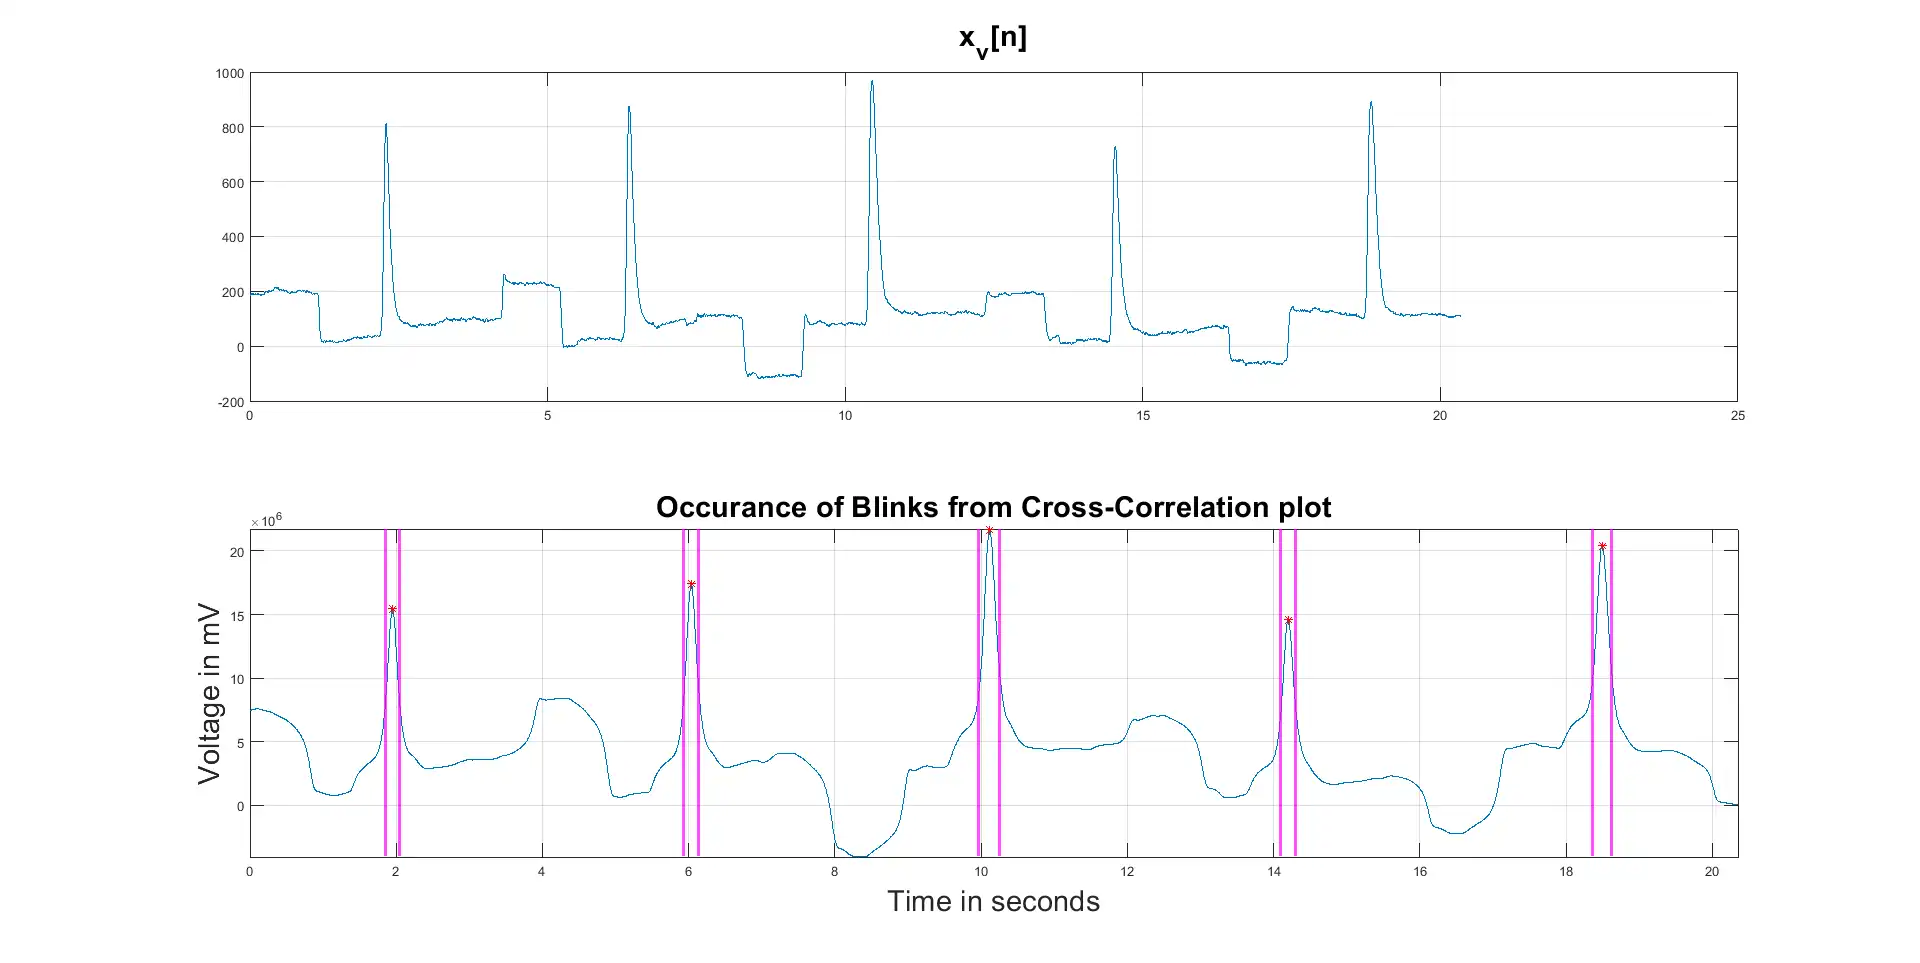
subplot(2, 1, 1);
plot(EOG_Time, EOG_Data_v);
title('x_v[n]', 'FontSize', fontSize);
grid on; 

Blink = EOG_Data_v(500:720); %template

[R, lags] = xcorr(EOG_Data_v, Blink); %cross-correlation
R = R(lags>=0);
lags = lags(lags>=0);

[peakValues, indexesOfPeaks, widths, proms] = findpeaks(R, 'MinPeakHeight',10e6); %finding peaks
subplot(2, 1, 2);
plot(EOG_Time, R);
title('Occurance of Blinks from Cross-Correlation plot', 'FontSize', fontSize);
xlabel('Time in seconds', 'FontSize', fontSize); 
ylabel('Voltage in mV', 'FontSize', fontSize); 
grid on; 
axis tight;
hold on;
plot(EOG_Time(indexesOfPeaks), peakValues, '*r')
% Plot widths
valleyIndexes = zeros(length(widths), 2);
for k = 1 : length(widths)
	% Get the indexes.
	valleyIndexes(k, 1) = floor(indexesOfPeaks(k) - widths(k)/2);
	valleyIndexes(k, 2) = ceil(indexesOfPeaks(k) + widths(k)/2);
	% Get the times.
	t1 = EOG_Time(valleyIndexes(k, 1));
	t2 = EOG_Time(valleyIndexes(k, 2));
	% Draw vertical lines on the plot.
	xline(t1, 'Color', 'm', 'LineWidth', 2);
	xline(t2, 'Color', 'm', 'LineWidth', 2);
end
hold off;
% Maximize figure window.
g = gcf;
g.WindowState = 'maximized'
fprintf('Done running %s.m.\n', mfilename);

finding points of signal


Not satisfied with the answer ?? ASK NOW

Frequently Asked Questions

MATLAB offers tools for real-time AI applications, including Simulink for modeling and simulation. It can be used for developing algorithms and control systems for autonomous vehicles, robots, and other real-time AI systems.

MATLAB Online™ provides access to MATLAB® from your web browser. With MATLAB Online, your files are stored on MATLAB Drive™ and are available wherever you go. MATLAB Drive Connector synchronizes your files between your computers and MATLAB Online, providing offline access and eliminating the need to manually upload or download files. You can also run your files from the convenience of your smartphone or tablet by connecting to MathWorks® Cloud through the MATLAB Mobile™ app.

Yes, MATLAB provides tools and frameworks for deep learning, including the Deep Learning Toolbox. You can use MATLAB for tasks like building and training neural networks, image classification, and natural language processing.

MATLAB and Python are both popular choices for AI development. MATLAB is known for its ease of use in mathematical computations and its extensive toolbox for AI and machine learning. Python, on the other hand, has a vast ecosystem of libraries like TensorFlow and PyTorch. The choice depends on your preferences and project requirements.

You can find support, discussion forums, and a community of MATLAB users on the MATLAB website, Matlansolutions forums, and other AI-related online communities. Remember that MATLAB's capabilities in AI and machine learning continue to evolve, so staying updated with the latest features and resources is essential for effective AI development using MATLAB.

Without any hesitation the answer to this question is NO. The service we offer is 100% legal, legitimate and won't make you a cheater. Read and discover exactly what an essay writing service is and how when used correctly, is a valuable teaching aid and no more akin to cheating than a tutor's 'model essay' or the many published essay guides available from your local book shop. You should use the work as a reference and should not hand over the exact copy of it.

Matlabsolutions.com provides guaranteed satisfaction with a commitment to complete the work within time. Combined with our meticulous work ethics and extensive domain experience, We are the ideal partner for all your homework/assignment needs. We pledge to provide 24*7 support to dissolve all your academic doubts. We are composed of 300+ esteemed Matlab and other experts who have been empanelled after extensive research and quality check.

Matlabsolutions.com provides undivided attention to each Matlab assignment order with a methodical approach to solution. Our network span is not restricted to US, UK and Australia rather extends to countries like Singapore, Canada and UAE. Our Matlab assignment help services include Image Processing Assignments, Electrical Engineering Assignments, Matlab homework help, Matlab Research Paper help, Matlab Simulink help. Get your work done at the best price in industry.