Question
h = stackedplot(rand(6,3)); I want to set x-axis ticks according to my own defined set i.e., instead of 1:6, I want to replace x-axisticks [1, 2,3 ,4,5,6] to ['A', 'S','T', 'AAA', 'BBB', 'ZZZ'] , by rotating it to 90 degree that is vertically insted of horizontally?
Expert Answer

Prashant Kumar
PhD Expert
Answered Oct 9, 2026
There does not seem to be an easy way to set the XTick or XTickLabel of a StackedLineChart object (such as what's created by stackedplot):
data = rand(6,3); h = stackedplot(1:6,data);
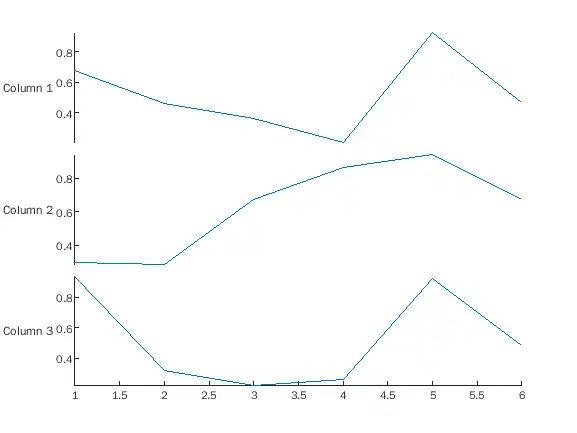
% try a couple of things, neither of which work try set(h,'XTick',1:6,'XTickLabel',{'A' 'S' 'T' 'AAA' 'BBB' 'ZZZ'}) catch ME disp(['Cannot use set(_,''XTick''): ' ME.message]); try xticks(h,1:6) catch ME disp(['Cannot use xticks(_): ' ME.message]); end end
Cannot use set(_,'XTick'): Unrecognized property XTick for class StackedLineChart. Cannot use xticks(_): Using xticks with stackedplot is not supported.
However, you can do it if you use tiledlayout (or subplot):
figure(); tiledlayout(3,1,'TileSpacing','tight'); for i = [1 2 3] ax = nexttile; plot(data(:,i)); box off if i < 3 set(get(ax,'XAxis'),'Visible','off'); end ylabel(ax,sprintf('Column %d',i), ... 'Rotation',0, ... 'HorizontalAlignment','right'); end % now ax is the bottom axes set(ax, ... 'XTick',1:6, ... 'XTickLabel',{'A','S','T','AAA','BBB','ZZZ'}, ... 'XTickLabelRotation',90);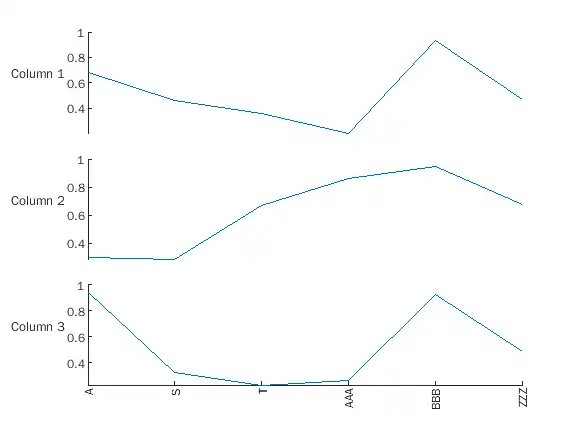
100% Run Guarantee
3-Hour Fast-Track Delivery
Need a Custom Version or Complete Simulation for This Problem?
Our 500+ PhD engineers build, debug, and optimize working MATLAB scripts and Simulink (.slx) models tailored to your exact assignment rubrics with zero plagiarism.
Tested on MATLAB R2024b / R2026a
Turnitin 0% Plagiarism Report
Free 7-Day Revisions Guarantee
Have a different question? Ask here
Related MATLAB Questions & Solutions
Browse All →
Explore similar technical troubleshooting questions and verified MATLAB solutions:
Ready-to-Run MATLAB & Simulink Projects
Browse All Projects →