How to fitline on my binary image and find distance

Hello, I have a question about my image processing problem. I have convert the image into binary and now i would like to use fitline on my image. Basically want to smooth the line with the curve. I am a beginner for MATLAB software. Please help me to find the solution. Also i want to find distance of one thin line to thick line (top to bottom). I am attachng my picture as png. Also my code is there.
 Prashant Kumar answered .
2025-11-20
Prashant Kumar answered .
2025-11-20
% By Image Analyst
clc; % Clear the command window.
close all; % Close all figures (except those of imtool.)
clear; % Erase all existing variables. Or clearvars if you want.
workspace; % Make sure the workspace panel is showing.
format long g;
format compact;
fontSize = 22;
%--------------------------------------------------------------------------------------------------------
% READ IN IMAGE
folder = pwd;
baseFileName = 'image.jpeg';
% Get the full filename, with path prepended.
fullFileName = fullfile(folder, baseFileName);
% Check if file exists.
if ~exist(fullFileName, 'file')
% The file doesn't exist -- didn't find it there in that folder.
% Check the entire search path (other folders) for the file by stripping off the folder.
fullFileNameOnSearchPath = baseFileName; % No path this time.
if ~exist(fullFileNameOnSearchPath, 'file')
% Still didn't find it. Alert user.
errorMessage = sprintf('Error: %s does not exist in the search path folders.', fullFileName);
uiwait(warndlg(errorMessage));
return;
end
end
grayImage = imread(fullFileName);
% Get the dimensions of the image.
% numberOfColorChannels should be = 1 for a gray scale image, and 3 for an RGB color image.
[rows, columns, numberOfColorChannels] = size(grayImage);
if numberOfColorChannels > 1
% It's not really gray scale like we expected - it's color.
% Use weighted sum of ALL channels to create a gray scale image.
grayImage = rgb2gray(grayImage);
% ALTERNATE METHOD: Convert it to gray scale by taking only the green channel,
% which in a typical snapshot will be the least noisy channel.
% grayImage = grayImage(:, :, 2); % Take green channel.
end
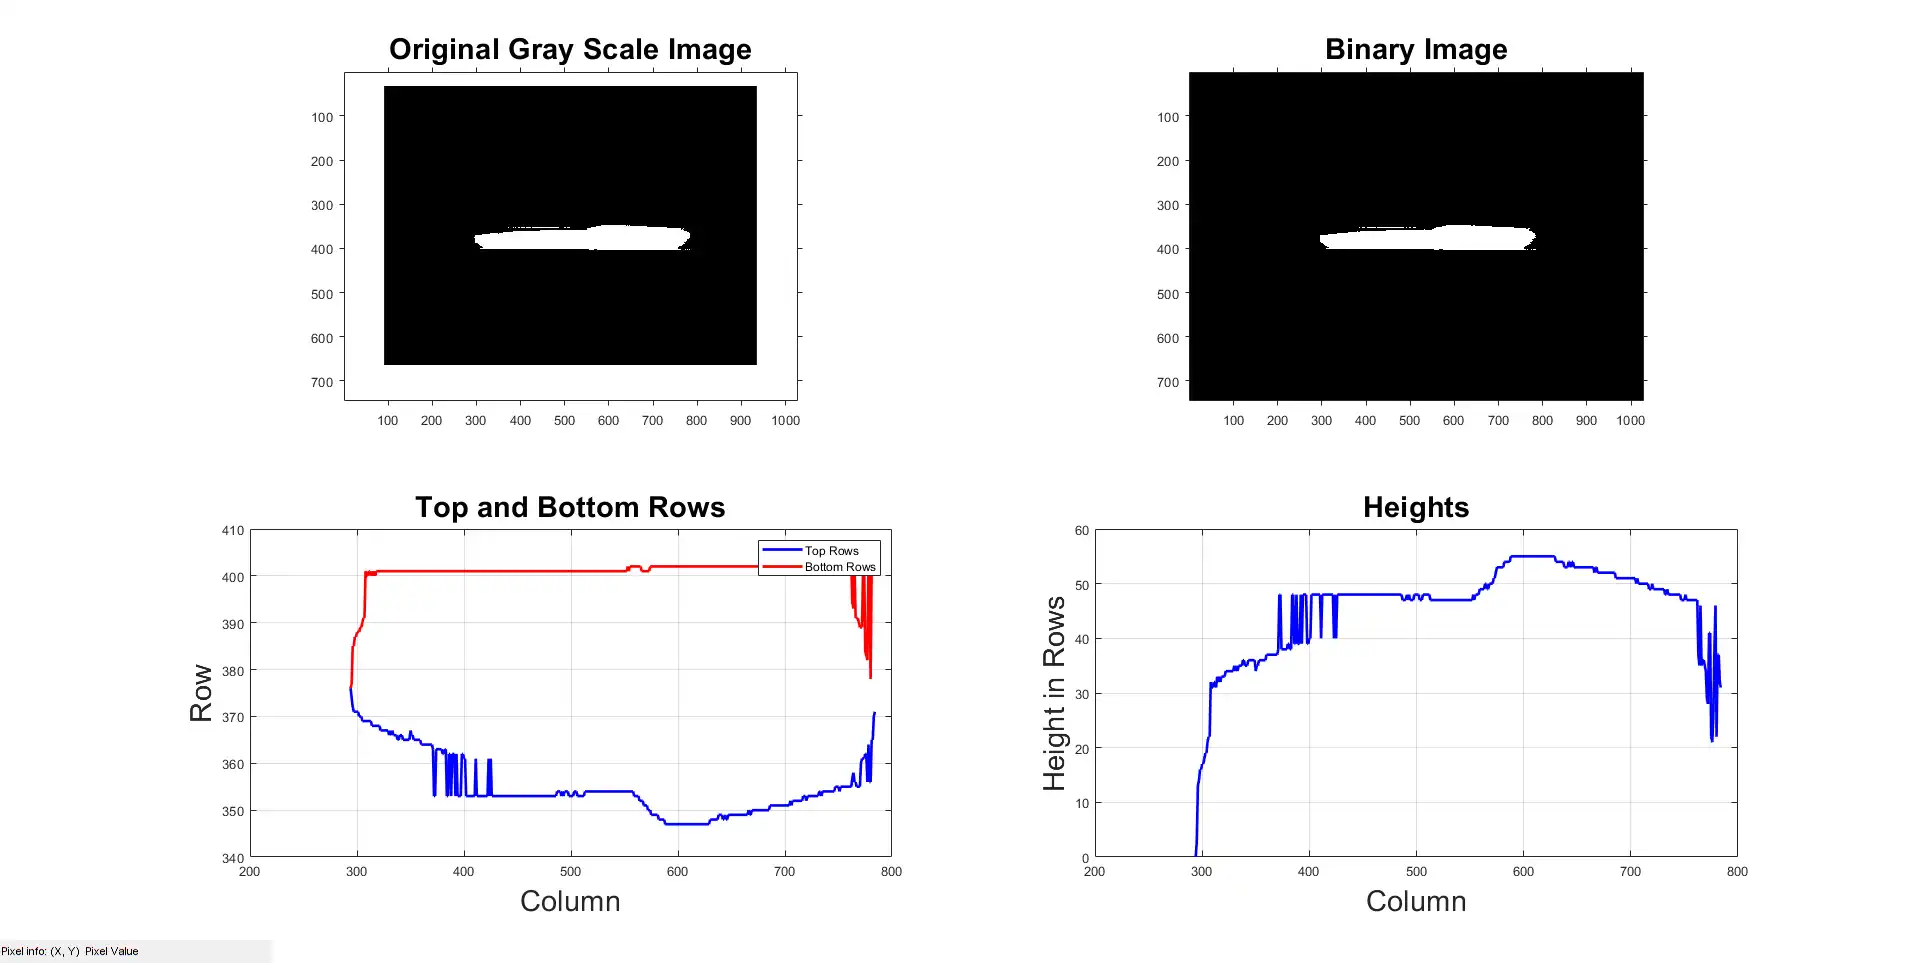
subplot(2, 2, 1);
imshow(grayImage, []);
impixelinfo;
title('Original Gray Scale Image', 'FontSize', fontSize, 'Interpreter', 'None');
hFig = gcf;
hFig.WindowState = 'maximized'; % May not work in earlier versions of MATLAB.
drawnow;
%--------------------------------------------------------------------------------------------------------
% SEGMENTATION OF IMAGE
% Get a binary image
binaryImage = imbinarize(grayImage);
% Get rid of big white frame around the border of the image.
binaryImage = imclearborder(binaryImage);
subplot(2, 2, 2);
imshow(binaryImage, []);
impixelinfo;
title('Binary Image', 'FontSize', fontSize, 'Interpreter', 'None');
hFig = gcf;
hFig.WindowState = 'maximized'; % May not work in earlier versions of MATLAB.
drawnow;
% Scan image finding the distance from topmost white pixel to bottommost.
topRows = nan(1, columns);
bottomRows = nan(1, columns);
for col = 1 : columns
thisColumn = binaryImage(:, col);
t = find(thisColumn, 1, 'first');
if ~isempty(t)
topRows(col) = t;
bottomRows(col) = find(thisColumn, 1, 'last');
end
end
% Plot top rows and bottom rows.
subplot(2, 2, 3);
x = 1 : columns;
plot(x, topRows, 'b-', 'LineWidth', 2);
grid on;
hold on;
plot(x, bottomRows, 'r-', 'LineWidth', 2);
title('Top and Bottom Rows', 'FontSize', fontSize);
xlabel('Column', 'FontSize', fontSize);
ylabel('Row', 'FontSize', fontSize);
legend('Top Rows', 'Bottom Rows');
% Plot heights.
heights = bottomRows - topRows;
subplot(2, 2, 4);
x = 1 : columns;
plot(x, heights, 'b-', 'LineWidth', 2);
grid on;
title('Heights', 'FontSize', fontSize);
xlabel('Column', 'FontSize', fontSize);
ylabel('Height in Rows', 'FontSize', fontSize);