Devendra asked . 2024-04-05

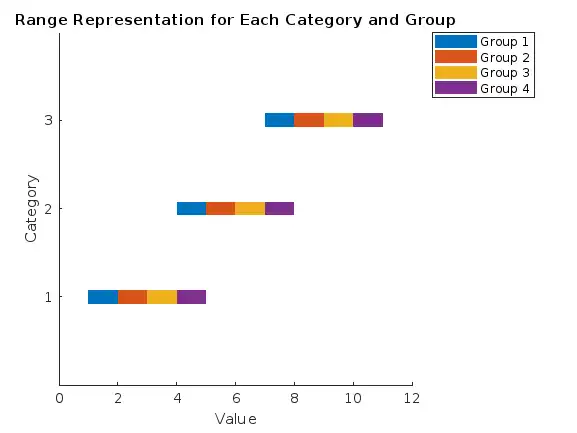
How to make the figure as attached?

I want to make the same figure with little different dates using matlab. Figure is attached. Please suggest me how to make it.

plot , gantt , MATLAB , Graphics , Graphics Performance

Expert Answer

Prashant Kumar answered . 2024-04-30 01:24:39

i understand that you are to make a plot same as above mentioned figure. This can be done by creating a bar plot in MATLAB with respect to the y-axis (i.e., horizontal bars) and having different legends for each group of bars can be achieved using the barh function for horizontal bar plots, and grouping the data appropriately. Please find the below attached code for the same:

% Sample range data for 3 categories, each with start and end values for 4 groups
dataStart = [1, 2, 3, 4; 4, 5, 6, 7; 7, 8, 9, 10]; % Start of range for each group
dataEnd = [2, 3, 4, 5; 5, 6, 7, 8; 8, 9, 10, 11]; % End of range for each group

% Categories for the y-axis
categories = 1:3; % Numeric categories for plotting

% Group labels (for legend)
groups = {'Group 1', 'Group 2', 'Group 3', 'Group 4'};
figure; % Create a new figure
hold on; % Hold on to plot multiple lines

[numCategories, numGroups] = size(dataStart);

% Colors or markers for each group - adjust as needed
colors = lines(numGroups); % Generate distinct colors

% Array to hold plot handles for legend
h = zeros(1, numGroups);

% Plotting ranges
for i = 1:numGroups
    % Plot each range for the group, only need to add one line per group to the legend
    for j = 1:numCategories
        % Plot each range as a line segment
        lineHandle = plot([dataStart(j,i), dataEnd(j,i)], [categories(j), categories(j)], ...
                          'Color', colors(i,:), 'LineWidth', 10);
        if j == 1
            % Save the handle for the first line of each group for the legend
            h(i) = lineHandle;
        end
    end
end

% Adjusting the plot
set(gca, 'ytick', categories, 'yticklabel', arrayfun(@num2str, categories, 'UniformOutput', false));
ylim([0, numCategories + 1]); % Adjust y-axis limits

% Create legend using handles to the first line of each group
legend(h, groups, 'Location', 'northeastoutside');
xlabel('Value'); % Label for the x-axis
ylabel('Category'); % Label for the y-axis
title('Range Representation for Each Category and Group'); % Title for the plot

hold off; % No more plots on this figure


Not satisfied with the answer ?? ASK NOW

Frequently Asked Questions

MATLAB offers tools for real-time AI applications, including Simulink for modeling and simulation. It can be used for developing algorithms and control systems for autonomous vehicles, robots, and other real-time AI systems.

MATLAB Online™ provides access to MATLAB® from your web browser. With MATLAB Online, your files are stored on MATLAB Drive™ and are available wherever you go. MATLAB Drive Connector synchronizes your files between your computers and MATLAB Online, providing offline access and eliminating the need to manually upload or download files. You can also run your files from the convenience of your smartphone or tablet by connecting to MathWorks® Cloud through the MATLAB Mobile™ app.

Yes, MATLAB provides tools and frameworks for deep learning, including the Deep Learning Toolbox. You can use MATLAB for tasks like building and training neural networks, image classification, and natural language processing.

MATLAB and Python are both popular choices for AI development. MATLAB is known for its ease of use in mathematical computations and its extensive toolbox for AI and machine learning. Python, on the other hand, has a vast ecosystem of libraries like TensorFlow and PyTorch. The choice depends on your preferences and project requirements.

You can find support, discussion forums, and a community of MATLAB users on the MATLAB website, Matlansolutions forums, and other AI-related online communities. Remember that MATLAB's capabilities in AI and machine learning continue to evolve, so staying updated with the latest features and resources is essential for effective AI development using MATLAB.

Without any hesitation the answer to this question is NO. The service we offer is 100% legal, legitimate and won't make you a cheater. Read and discover exactly what an essay writing service is and how when used correctly, is a valuable teaching aid and no more akin to cheating than a tutor's 'model essay' or the many published essay guides available from your local book shop. You should use the work as a reference and should not hand over the exact copy of it.

Matlabsolutions.com provides guaranteed satisfaction with a commitment to complete the work within time. Combined with our meticulous work ethics and extensive domain experience, We are the ideal partner for all your homework/assignment needs. We pledge to provide 24*7 support to dissolve all your academic doubts. We are composed of 300+ esteemed Matlab and other experts who have been empanelled after extensive research and quality check.

Matlabsolutions.com provides undivided attention to each Matlab assignment order with a methodical approach to solution. Our network span is not restricted to US, UK and Australia rather extends to countries like Singapore, Canada and UAE. Our Matlab assignment help services include Image Processing Assignments, Electrical Engineering Assignments, Matlab homework help, Matlab Research Paper help, Matlab Simulink help. Get your work done at the best price in industry.