Question
I'm new to matlab. I want to generate noise samples of Gaussian mixture with PDF= sqrt((u.^3)./pi).*exp(-u.*(x.^2)) + sqrt((1-u)^3/pi).*exp(-(1-u).*x.^2); The length of noise sample is (1,200) Please help me out.
Expert Answer

Prashant Kumar
PhD Expert
Answered Sep 30, 2026
Ok, so you have formulated what seems to me to be a rather strange mixture model.
You have two modes, with variances that are related to each other, the mean of both terms is zero.
So, if the PDF is:
PDF = sqrt((u.^3)./pi).*exp(-u.*(x.^2)) + sqrt((1-u)^3/pi).*exp(-(1-u).*x.^2)
So we have two terms there.
syms u positive
syms x real
Look at the first term:
pdf1 = sqrt((u.^3)./pi).*exp(-u.*(x.^2));
int(pdf1,x,[-inf,inf])
ans =
u
So, it integrates to u. The second term is similar,
pdf2 = sqrt(((1-u).^3)./pi).*exp(-(1-u).*(x.^2));
int(pdf2,x,[-inf,inf])
ans =
piecewise([u == 1, 0], [1 < u, Inf*1i], [u < 1, 1 - u])
For u <= 1, it integrates to 1-u.
So the integral of the sum is indeed 1, therefore it is a valid PDF.
Essentially, you have two Gaussian modes, such that the variances are 2/u and 2/(1-u) respectively. You have chosen the mixture parameter as the inverse of those variances. Effectively, when u is small (or very near 1), you have a mixture distribution that rarely, you will generate large outliers. When u is exactly 1/2, this reduces to a standard normal distribution, with a unit variance.
I'm not sure why, but I suppose that is not really important. Normally, one would choose a mixture parameter that is independent of the variances.
The solution is simple.
1. Pick some value for u. u determines both variances for each Gaussian mode, as well as the mixture coefficient.
2. For a sample size of N, pick N uniformly distributed random numbers. These will determine which mode you will sample from. Then just use a classical tool like randn to do the sampling.
For a sample size of 1e7, and some arbitrary value for u, say 1/100. I've picked a tiny value for u to make the result clear. I've also chosen a large sample to make it easier to see as a histogram.
N = 10000000;
u = 0.01;

% random mixture selection
% Here s will be 1 if the element is sampled from first pdf.
%      s will be 0 if the element is sampled from second pdf.
s = rand(1,N) < u;

% sample using randn, with a unit variance initially
x = randn(1,N);;

% now scale each element based on the desired variance
x(s) = x(s)*sqrt(2/u);
x(~s) = x(~s)*sqrt(2/(1-u));

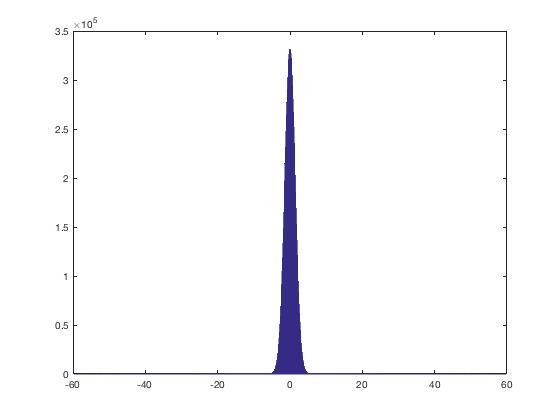
hist(x,1000)
So, for this fairly tiny value of u, see that the histogram looks much like a traditional Gaussian, BUT with very wide tails.
I'll next plot the separate pieces of the PDF, split into two parts. Here I've chosen u as 0.25.
pdf1 = @(x,u) sqrt((u.^3)./pi).*exp(-u.*(x.^2));
pdf2 = @(x,u) sqrt(((1-u).^3)./pi).*exp(-(1-u));

h1 = ezplot(@(x) pdf1(x,0.25),[-10,10]);
hold on
h2 = ezplot(@(x) pdf2(x,0.25),[-10,10]);
title 'pdf1 and pdf2, split apart'
So, the sampling was rather simple. No need to do anything strenuous. I still have no idea why you want this distribution, but whatever floats your boat is a good thing.
100% Run Guarantee
3-Hour Fast-Track Delivery
Need a Custom Version or Complete Simulation for This Problem?
Our 500+ PhD engineers build, debug, and optimize working MATLAB scripts and Simulink (.slx) models tailored to your exact assignment rubrics with zero plagiarism.
Tested on MATLAB R2024b / R2026a
Turnitin 0% Plagiarism Report
Free 7-Day Revisions Guarantee
Have a different question? Ask here
Related signal processing Questions & Solutions
Browse All →
Explore similar technical troubleshooting questions and verified MATLAB solutions:
Ready-to-Run MATLAB & Simulink Projects
Browse All Projects →