Plotting 3D by rotate 2D plot around y-axis

I have a question to draw a 3D cup of coffe (no need to draw a handle). I think to be easy we need to draw 2 parabol ( inner and outter ) , the upper bound and bottom bound, then rotate that 2D plot around y-axis, but I dont have any idea and knowledge to do that, is there another way ? Can anyone help me with this, many thanks
 Prashant Kumar answered .
2025-11-20
Prashant Kumar answered .
2025-11-20
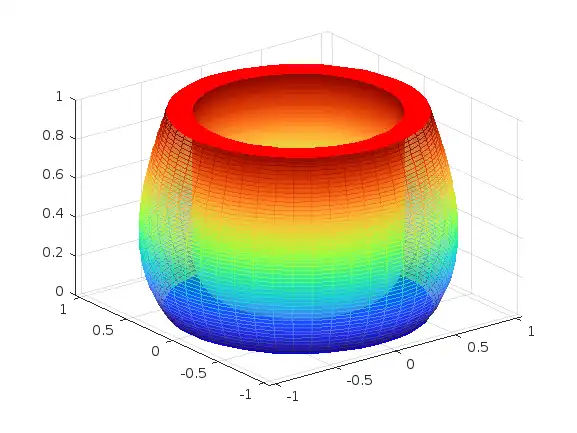
Probably the easiest way is to define a cylinder and a shape vector —
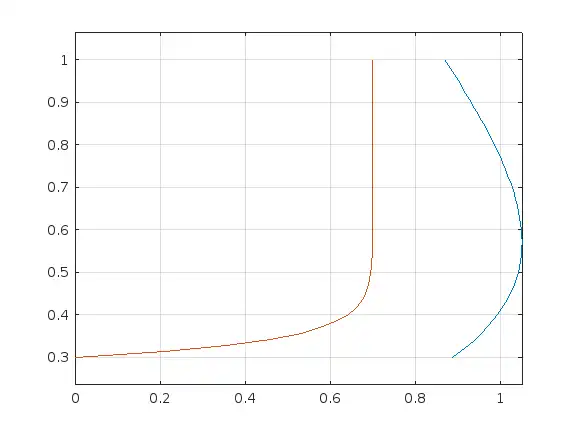
yv = [linspace(0.3, 1, 50)];
ys1 = yv.*exp(-1.75*yv)*5;
ys2 = (1-exp(-25*(yv-0.3)))*0.7;

figure
plot(ys1, yv)
hold on
plot(ys2, yv)
hold off
grid
% xlim([0 1.5])
axis ('equal')

[X1,Y1,Z1] = cylinder(ys1,50);
[X2,Y2,Z2] = cylinder(ys2,50);

figure
surf(X1,Y1,Z1, 'EdgeColor','interp', 'FaceAlpha',0.5)                                               % Outer Surface
hold on
surf(X2,Y2,Z2, 'EdgeColor','interp')                                                                % Inner Survface
patch([X1(end,:) X2(end,:)], [Y1(end,:) Y2(end,:)], [Z1(end,:) Z2(end,:)], 'r', 'EdgeColor','r')    % Top Rim
patch([X1(1,:) X2(1,:)], [Y1(1,:) Y2(1,:)], [Z1(1,:) Z2(1,:)], 'b', 'EdgeColor','b')                % Lower Surface

hold off
colormap(turbo)
[X1,Y1,Z1] = cylinder(ys1,50);
[X2,Y2,Z2] = cylinder(ys2,50);
figure
surf(X1,Y1,Z1, 'EdgeColor','interp', 'FaceAlpha',0.5)                                               % Outer Surface
hold on
surf(X2,Y2,Z2, 'EdgeColor','interp')                                                                % Inner Survface
patch([X1(end,:) X2(end,:)], [Y1(end,:) Y2(end,:)], [Z1(end,:) Z2(end,:)], 'r', 'EdgeColor','r')    % Top Rim
patch([X1(1,:) X2(1,:)], [Y1(1,:) Y2(1,:)], [Z1(1,:) Z2(1,:)], 'b', 'EdgeColor','b')                % Lower Surface
hold off
colormap(turbo)