Question
I have a column vector of data (23038 x 1), which corresponds to a column vector of the same length for latitude and another for longitude. I am attempting to plot this data (I have used surfm, surfacem, pcolorm), but it always causes MATLAB to slow down to the point of crashing. I assume that this is because matlab prefers the data to be oriented at a 2D matrix (grid). Is this correct, and if so how would I convert the data for plotting? Thanks!
Expert Answer

Prashant Kumar
PhD Expert
Answered Oct 7, 2026
First of all, really neat looking map when you just plot the points at which the data was taken:
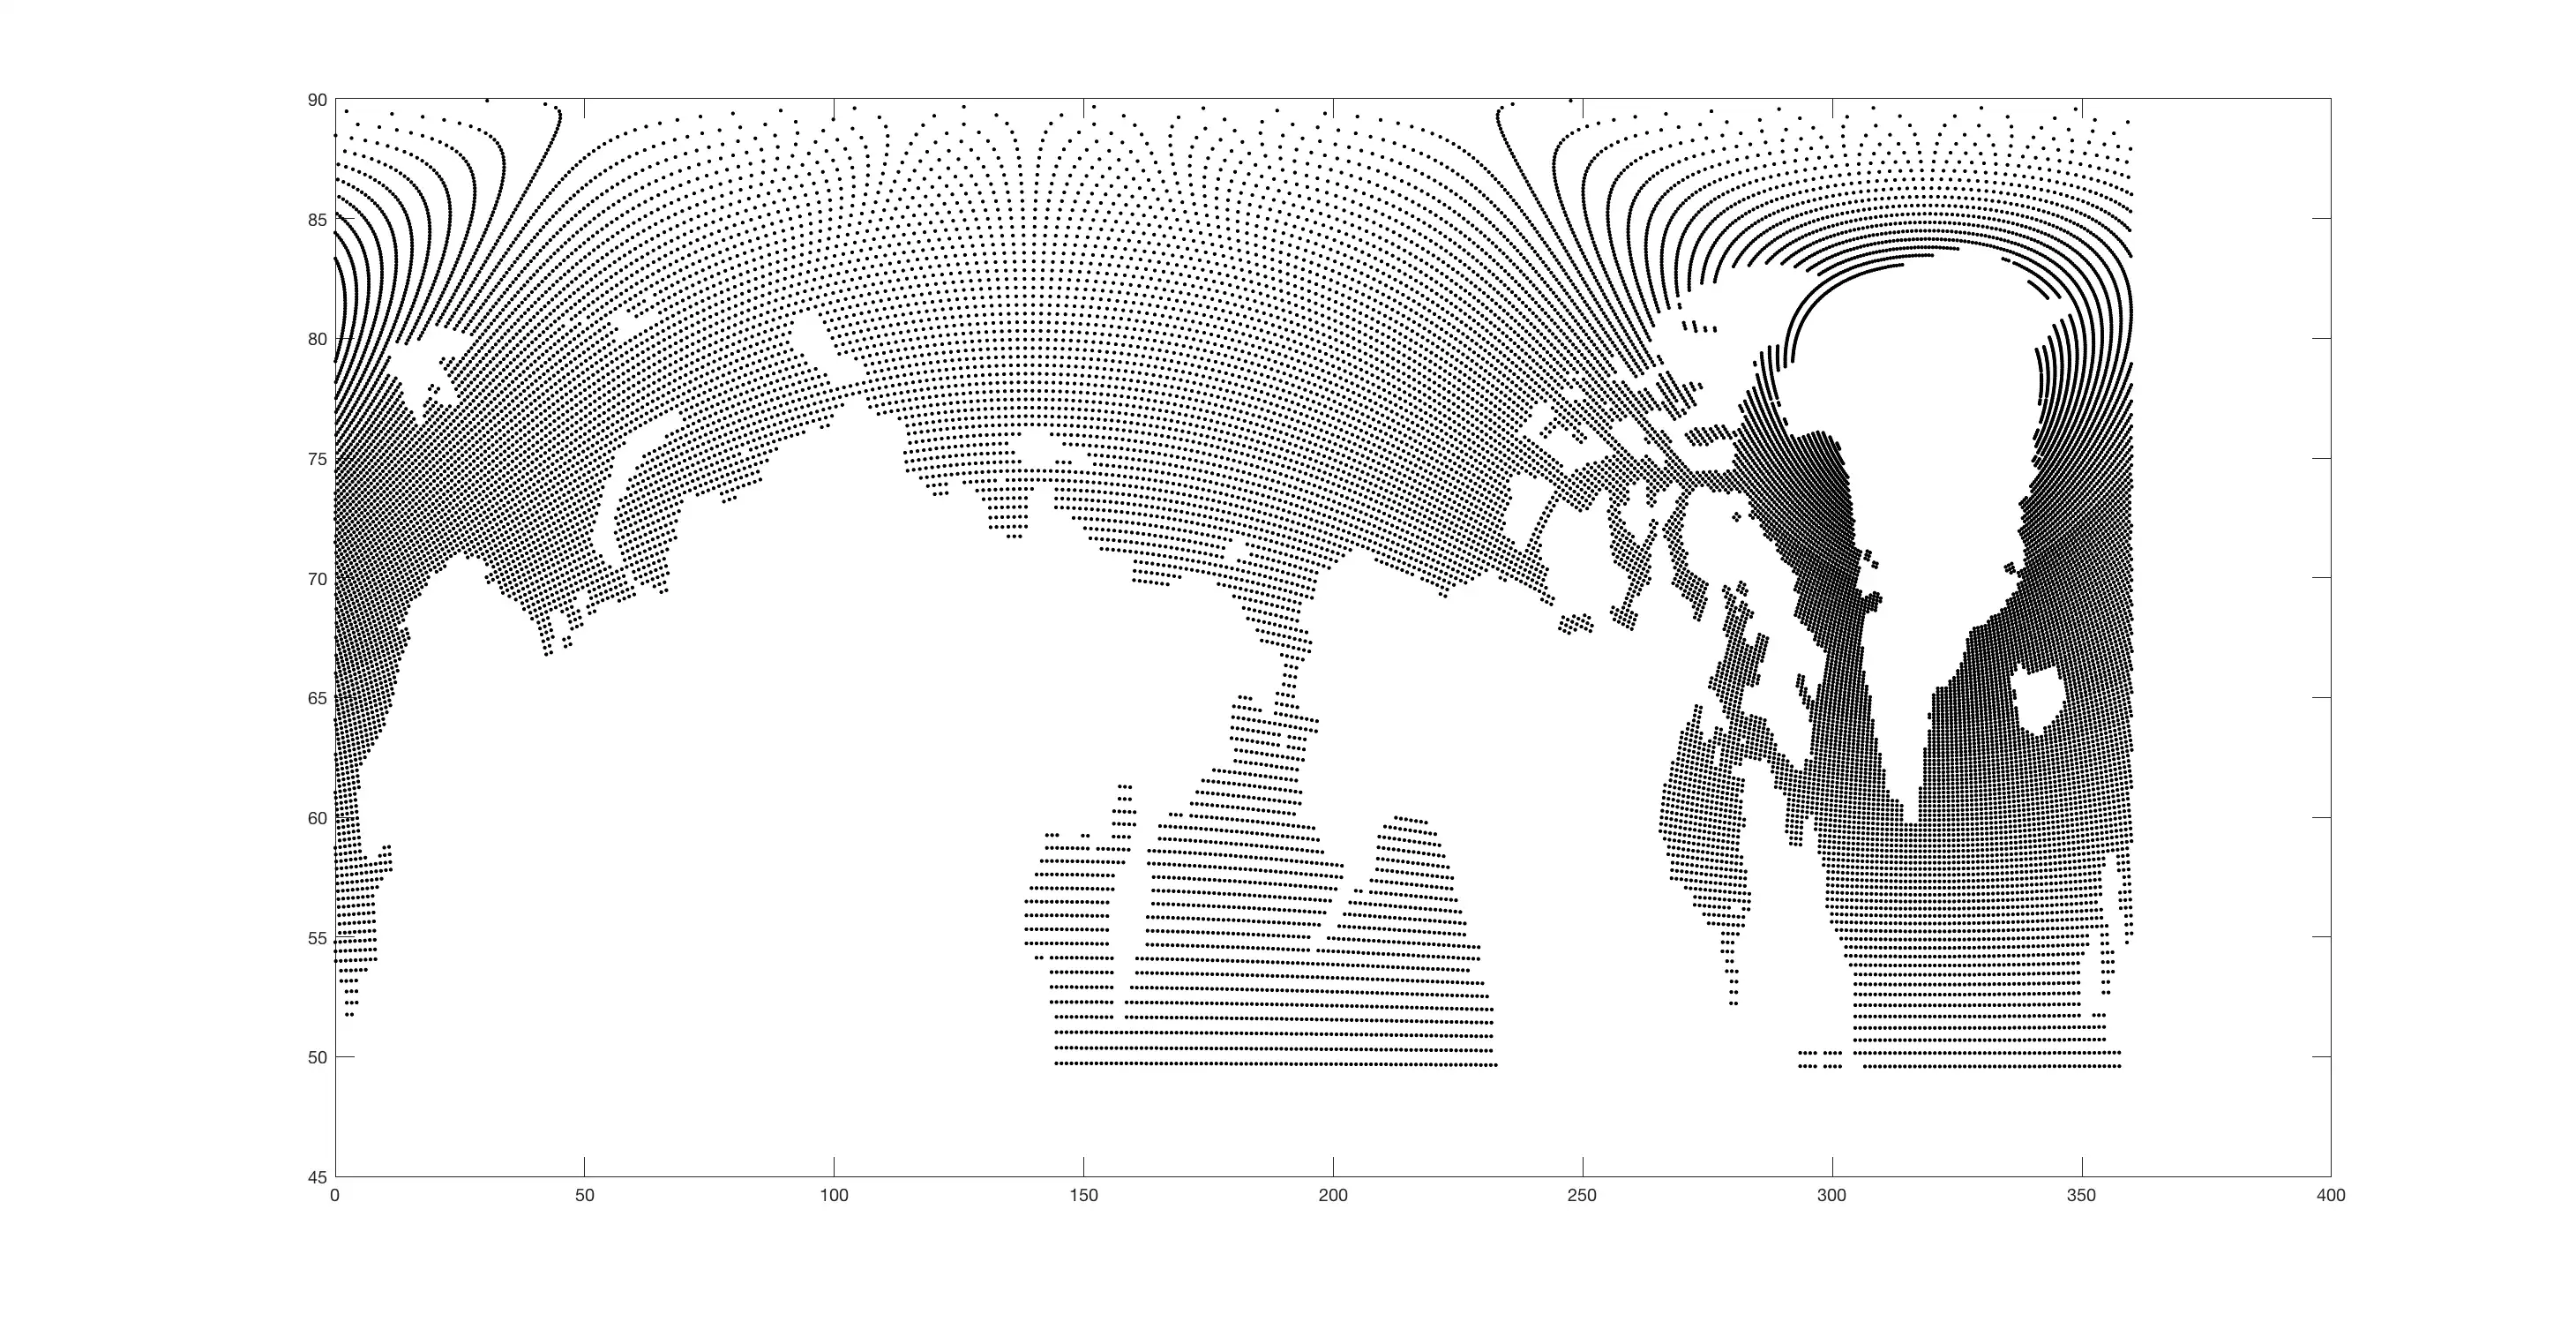
Using griddata, you can mesh out your current dataset into a grid:
latmin = min(lat_piomas);
latmax = max(lat_piomas);
lonmin = min(lon_piomas);
lonmax = max(lon_piomas);
gridSize = [100 200];
latvec = linspace(latmin, latmax, gridSize(1));
lonvec = linspace(lonmin, lonmax, gridSize(2));
[LatQ LonQ] = ndgrid(latvec, lonvec);
ThickQ = griddata(lon_piomas, lat_piomas, thickness, LonQ, LatQ);
From there, it's a simple matter to show the data in whichever format you like:
figure
axesm('mercator', 'MapLonLimit', [0 360])
geoshow(LatQ, LonQ, ThickQ, 'DisplayType', 'surface')

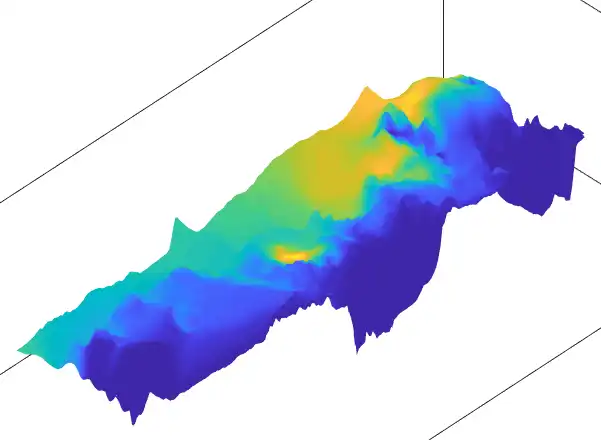
And if you want to get real fancy, you can use topological data to show the elevation of the surface, while using the color to show the "thickness" data. Here's an example using built-in example topography data:
% Get example topography data
load topo topo topolatlim topolonlim
Rtopo = georefcells(topolatlim, topolonlim, size(topo));
ElevQ = geointerp(topo, Rtopo, LatQ, LonQ, 'cubic');

% Display the surface
figure
axesm('mercator', 'MapLonLimit', [0 360])
geoshow(LatQ, LonQ, ElevQ, 'DisplayType', 'surface', 'CData', ThickQ)
daspectm('m', 1000) % To exaggerate the height of the topography
100% Run Guarantee
3-Hour Fast-Track Delivery
Need a Custom Version or Complete Simulation for This Problem?
Our 500+ PhD engineers build, debug, and optimize working MATLAB scripts and Simulink (.slx) models tailored to your exact assignment rubrics with zero plagiarism.
Tested on MATLAB R2024b / R2026a
Turnitin 0% Plagiarism Report
Free 7-Day Revisions Guarantee
Have a different question? Ask here
Related plotting Questions & Solutions
Browse All →
Explore similar technical troubleshooting questions and verified MATLAB solutions:
Ready-to-Run MATLAB & Simulink Projects
Browse All Projects →