How can I explode consecutive pie chart wedges together?

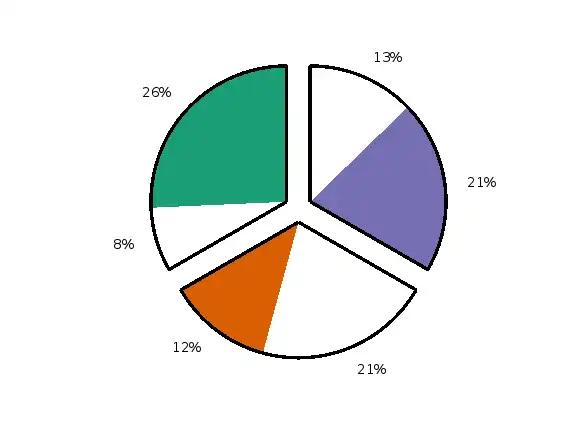
I'm generating the below pie chart, which plots displays the percentage of occurrence of distinct events, and how many times these events do not occur. The pie chart is divided into a number of equal sized "larger" segments based on the num_events parameter. In the example, this is three (divided by the black lines). Within each of these segments the percentage of occurrence is shaded, while the percentage of non-occurrence is left white. Would it be possible to explode the shaded region along with its neighboring white region, together as in the figure on the right? num_events=3; % numTx has to be less than or equal to 7. scenarios = 1; begin_a = 97; data = rand(scenarios,num_events); figure overlayCircleOnPieCharts(data,num_events); %% Function to plot pie chart, remove the boundary and dividing lines. function ax = overlayCircleOnPieCharts(clearance,num_events) [numRowC,numColC] = size(clearance); if numColC~=num_events disp("Error: check unequal dimensions. Verify number of treatments.") return; end c_matrix = 100*clearance; % convert data to percentages nc_matrix = 100*ones(numRowC,numColC) - c_matrix; % calculate non-clearance percentages n_nc_matrix = reshape([c_matrix;nc_matrix],size(c_matrix,1),[]); % reshape to have matrix with alternating columns of clearance non-clearance norm_matrix = n_nc_matrix./(num_events*100); % normalizes the data non_clearance_color = ones(num_events,3); clearance_color = [hex2rgb('#1B9E77') hex2rgb('#D95F02') hex2rgb('#7570B3') hex2rgb('#E7298A') hex2rgb('#66A61E') hex2rgb('#E6AB02') hex2rgb('#A6761D')]; colrs = reshape([clearance_color(1:num_events,:)';non_clearance_color'],3,[])'; % creates colors correctly tiledlayout('flow'); for k = 1:numRowC a_pi = nexttile; pie(norm_matrix(k,:)); hold on % pie chart, with outlines removed pi_bakery = gca; pi_bakery.Colormap = colrs; % set colors, data contained in clearance matrix is shaded pi_bakery.Children(2).EdgeAlpha = 0; pi_bakery.Children(4).EdgeAlpha = 0; pi_bakery.Children(6).EdgeAlpha = 0; pi_bakery.Children(8).EdgeAlpha = 0; pi_bakery.Children(10).EdgeAlpha = 0; pi_bakery.Children(12).EdgeAlpha = 0; % circle overlayed, divided in num_events equal sections x_cent = 0; y_cent=0; r=1; th = 0:pi/50:2*pi; xunit = r * cos(th) + x_cent; yunit = r * sin(th) + y_cent; plot(xunit, yunit,'k','LineWidth',2.5); plot([x_cent x_cent],[y_cent y_cent+r],'k','LineWidth',3) % Top line for j = 1:num_events%numTx [edit to get the code to run - Voss] plot([x_cent (x_cent + r*sin(2*pi*((1+j)/num_events)))],[y_cent (y_cent +r*cos(2*pi*((1+j)/num_events)))],'k','LineWidth',2.5) % right hand side line end end end
 Prashant Kumar answered .
2025-11-20
Prashant Kumar answered .
2025-11-20
I don't see a way to explode slices together in pairs with the pie function (each slice would be exploded or not-exploded independently of the other slices, so adjacent exploded slices would not touch each other), but you can create the effect you want by creating the patch and text objects similarly to how pie does and incorporating the desired modifications.
num_events=3; % numTx has to be less than or equal to 7.
scenarios = 1;
data = rand(scenarios,num_events);
figure
overlayCircleOnPieCharts(data,num_events);
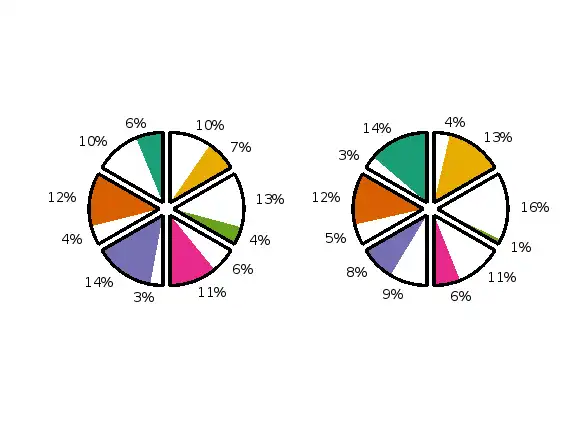
num_events=6; % numTx has to be less than or equal to 7.
scenarios = 2;
data = rand(scenarios,num_events);
figure
overlayCircleOnPieCharts(data,num_events);
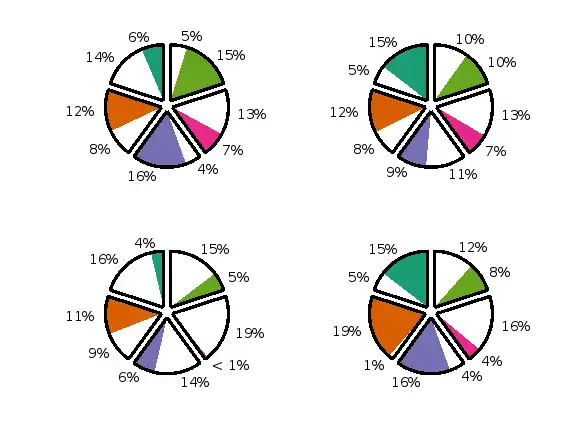
num_events=5; % numTx has to be less than or equal to 7.
scenarios = 4;
data = rand(scenarios,num_events);
figure
overlayCircleOnPieCharts(data,num_events);
%% Function to plot pie chart, remove the boundary and dividing lines.
function ax = overlayCircleOnPieCharts(clearance,num_events)
[numRowC,numColC] = size(clearance);
if numColC~=num_events
    disp("Error: check unequal dimensions. Verify number of treatments.")
    return;
end
c_matrix = 100*clearance; % convert data to percentages
nc_matrix = 100 - c_matrix; % calculate non-clearance percentages
n_nc_matrix = reshape([c_matrix;nc_matrix],size(c_matrix,1),[]); % reshape to have matrix with alternating columns of clearance non-clearance
norm_matrix = n_nc_matrix./(num_events*100); % normalizes the data
non_clearance_color = ones(num_events,3);
clearance_color = [hex2rgb('#1B9E77')
    hex2rgb('#D95F02')
    hex2rgb('#7570B3')
    hex2rgb('#E7298A')
    hex2rgb('#66A61E')
    hex2rgb('#E6AB02')
    hex2rgb('#A6761D')];
colrs = reshape([clearance_color(1:num_events,:)';non_clearance_color'],3,[])'; % creates colors correctly

tiledlayout('flow');
% start, end, and center angles for each wedge
dth = 2*pi/num_events;
th_start = pi/2+dth*(0:num_events-1);
th_end = pi/2+dth*(1:num_events);
th_center = th_start+dth/2;
% distance to "explode" wedges outward
d = 0.1;
% offset for exploding (shifting out from center)
x_offset = d*cos(th_center);
y_offset = d*sin(th_center);
% factor for determining where to place the texts,
% e.g., 1.15 means 15% beyond where the unexploded
% circle would be, measured from the center
f_t = 1.15;
% for horizontal alignment of texts (texts on right-half plane are
% left-aligned, and texts of left half-plane are right-aligned,
% similar to how pie() works, I think)
h_alignment = {'left','right'};
for k = 1:numRowC

    a_pi = nexttile;

    % set axes square and turn off (like pie() does)
    axis(a_pi,'square','off')

    % angles of the boundaries between c and nc regions
    th_boundary = pi/2+dth*((0:num_events-1)+norm_matrix(k,1:2:end)*num_events);

    % for each wedge:
    for j = 1:num_events%numTx

        % coordinates of arc for c part
        th = linspace(th_start(j),th_boundary(j),100);
        x_c = cos(th);
        y_c = sin(th);

        % coordinates of arc for nc part
        th = linspace(th_boundary(j),th_end(j),100);
        x_nc = cos(th);
        y_nc = sin(th);

        % create the c and nc region patches
        patch(x_offset(j)+[0 x_c 0],y_offset(j)+[0 y_c 0],colrs(2*j-1,:),'EdgeColor','none')
        patch(x_offset(j)+[0 x_nc 0],y_offset(j)+[0 y_nc 0],colrs(2*j,:),'EdgeColor','none')

        % create the wedge outline
        line(x_offset(j)+[0 x_c x_nc 0],y_offset(j)+[0 y_c y_nc 0],'Color','k','LineWidth',2.5)

        % create the c text
        x_t = f_t*(x_offset(j)+x_c(round(end/2)));
        y_t = f_t*(y_offset(j)+y_c(round(end/2)));
        val = 100*norm_matrix(k,2*j-1);
        if val < 1
            str = '< 1%';
        else
            str = sprintf('%.0f%%',val);
        end
        text(x_t,y_t,str,'HorizontalAlignment',h_alignment{1+(x_t < 0)})

        % create the nc text
        x_t = f_t*(x_offset(j)+x_nc(round(end/2)));
        y_t = f_t*(y_offset(j)+y_nc(round(end/2)));
        val = 100*norm_matrix(k,2*j);
        if val < 1
            str = '< 1%';
        else
            str = sprintf('%.0f%%',val);
        end
        text(x_t,y_t,str,'HorizontalAlignment',h_alignment{1+(x_t < 0)})

    end

    % set the viewed area of the axes
    xlim((1.2+d)*[-1 1])
    ylim((1.2+d)*[-1 1])

end
end