Question
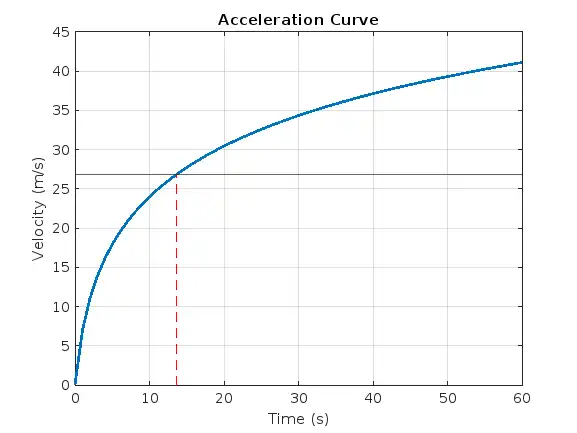
I have an acceleration curve and i need to find the 0-60mph (0-26.8224m/s) Stuck on how to get there, currently only have a yline that shows where 26.8224m/s along the y-axis. Please help! Here's my code and a picture of the graph: figure(6) P1 = plot(tout,yout(:,1)); xlabel('Time (s)') ylabel('Velocity (m/s)') grid on set(P1,'linewidth',2) title('Acceleration Curve') yline(26.8224)
Expert Answer

Prashant Kumar
PhD Expert
Answered Oct 10, 2026
% some data:
tout = (0:60).';
yout = 10*log(tout+1);
y_val = 26.8224;
% your plot:
P1 = plot(tout,yout(:,1),'linewidth',2);
xlabel('Time (s)')
ylabel('Velocity (m/s)')
grid on
title('Acceleration Curve')
yline(y_val)
% find the t value where y is y_val:
t0 = interp1(yout(:,1),tout,y_val)
t0 = 13.6259
% plot a vertical red line to that point on the curve:
hold on
plot([t0,t0],[0,y_val],'--r')
100% Run Guarantee
3-Hour Fast-Track Delivery
Need a Custom Version or Complete Simulation for This Problem?
Our 500+ PhD engineers build, debug, and optimize working MATLAB scripts and Simulink (.slx) models tailored to your exact assignment rubrics with zero plagiarism.
Tested on MATLAB R2024b / R2026a
Turnitin 0% Plagiarism Report
Free 7-Day Revisions Guarantee
Have a different question? Ask here
Related y-intercept Questions & Solutions
Browse All →
Explore similar technical troubleshooting questions and verified MATLAB solutions:
Ready-to-Run MATLAB & Simulink Projects
Browse All Projects →