How to make peaks of a plot smooth in MATLAB?

I want to make the edges shown in the figure smooth. I have used interpolation but I want to makes these edges more smooth. Please help me.Below is my code. clear all; close all; clc; x= [0,0.1,0.2,0.3,0.4,0.5,0.6,0.7,0.8,0.9,1]; y1 = [0 0.0833 0.1583 0.2167 0.1500 0.3250 0.3750 0.3000 0.5917 0.3750 0.5000]; y2= [ 0 0 0.0167 0.0750 0.1000 0.0917 0.1167 0.1583 0.1083 0.2000 0.1833]; figure(1) plot (x,y1) hold on plot (x,y2) figure (2) Xi = 0:0.005:1; Yi = pchip(x,y1,Xi); plot(Xi,Yi) hold on Yj = pchip(x,y2,Xi); plot(Xi,Yj)
 John Williams answered .
2025-11-20
John Williams answered .
2025-11-20
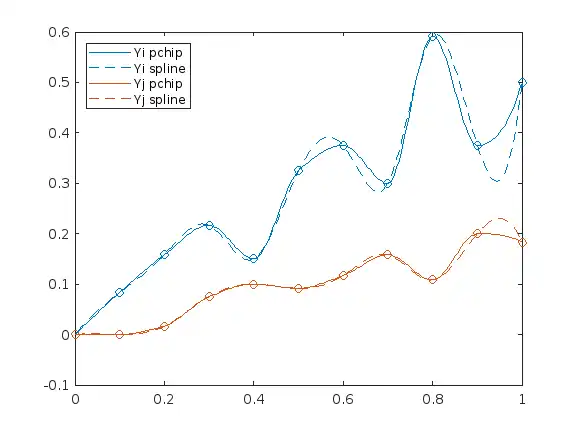
If you want a smoother interpolation result, spline can be a better way for you.
x= [0,0.1,0.2,0.3,0.4,0.5,0.6,0.7,0.8,0.9,1];
y1 = [0    0.0833    0.1583    0.2167    0.1500    0.3250    0.3750    0.3000    0.5917    0.3750    0.5000];
y2=  [ 0         0    0.0167    0.0750    0.1000    0.0917    0.1167    0.1583    0.1083    0.2000    0.1833];
figure
plot (x,y1,'o')
hold on
plot (x,y2,'o')

Xi = 0:0.005:1;
Yi = pchip(x,y1,Xi);
Yi_spline = spline(x,y1,Xi);
h(1) = plot(Xi,Yi,'-','color',lines(1));
h(2) = plot(Xi, Yi_spline, '--', 'color', lines(1));
Yj = pchip(x,y2,Xi);
Yj_spline = spline(x, y2, Xi);
h(3) = plot(Xi,Yj,'-','color',[0.85, 0.325, 0.098]);
h(4) = plot(Xi,Yj_spline,'--','color',[0.85, 0.325, 0.098]);
legend(h, "Yi pchip", "Yi spline", "Yj pchip", "Yj spline", "location", "NW")