How to use boxchart and GroupByColor when having a matrix?

I am trying to use a boxchart for plotting a (10000,10) matrix, where each column represents a single box. In other words, I would like to plot a boxchart consisting of 10 boxes and 10,000 data points. The problem is that all Answers in the forum I have read so far are related to vectors, not matrices. All my attempts of using boxchart have resulted in an error, which states that I cannot use a matrix but vectors. Transforming the matrix into a vector is not possible. Additionally, I would like to group the 10 columns in 3 categories by assigning each box the respective color: column [1 2 3 4 5 6 7 8 9 10] group [A A B C C B A B C A] color: [r r g b b g r g b r ] However, I cannot provide a vector with values and tell Matlab to group the columns of the matrix on the basis of a specific threshold (e.g. temperature), but I have to do this manually by paper and pencil and inform Matlab which column belongs to which group myself. I use the following code: figure (2) groupname={'A','A','B','C','C','B','A','B','C','A'}'; boxchart(AX.t_k,'MarkerStyle', 'none','GroupByColor', groupname); % AX.t_k = (10000,10) matrix And I get the following error: Error using boxchart 'GroupByColor' parameter is not supported when the sample data argument is a matrix. Could someone tell me, how I can use boxchart when using a matrix and how I can group each column with their respective color?
 John Williams answered .
2025-11-20
John Williams answered .
2025-11-20
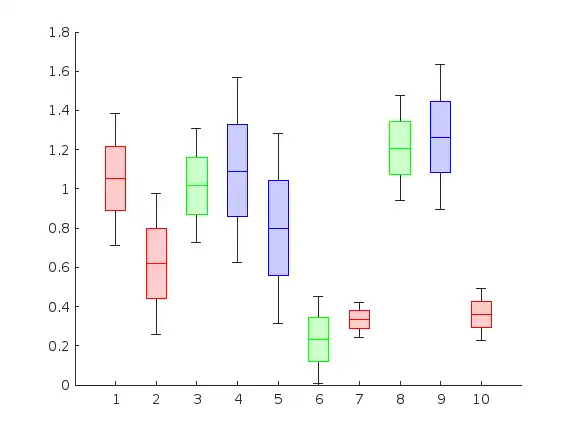
Try This:
% generate some random data:
N = 10000;
M = 10;
AX = struct('t_k',zeros(N,M));
for ii = 1:M
    AX.t_k(:,ii) = rand()*rand(N,1)+rand();
end

% plot 10 separate boxcharts, and color each one appropriately:
groupname = {'A','A','B','C','C','B','A','B','C','A'};
colors = 'rgb';
colors = colors(findgroups(groupname));
[N,M] = size(AX.t_k);
hold on
for ii = 1:M
    boxchart(AX.t_k(:,ii),'MarkerStyle','none','BoxFaceColor',colors(ii),'XData',ii*ones(N,1))
end
ax = gca();
ax.XAxis.Categories = categorical(1:M);