How to use isoutlier based in a part of the data?

I have a vector of datas. Like this, a =[0;0.0028;0.0002;0.0039;0.0061]. As you see, since the 4° element, the values start growing more until the end. I was trying to determine a threshold to define the 4° and 5° elements as ouliers using 'isoutlier' function from Matlab. I did it. But I had to define a fixed 'ThresholdFactor'value using one of the methods the function has. I would like the 4° and 5° values to being identified as outliers. Not based with all the vector datas, but because they are bigger than the 1°, 2° and 3° elements. I mean, I would like to find the outliers based on the backforward datas [0;0.0028;0.0002]. The vector I posted is an example. The size must be generic. Can you help me? P.S. (Actualized): As I said, depending of the data entries, my vectors gonna have different sizes. But in all cases, the phenomenum they represent, makes the vector values would be bigger at the end. I can't find a way to define when the datas gonna be outliers since the vector will not always be the same. I need to generalize. So what I really need is to identify when the values start growing until reach the end. For instance, for my example, it would happen from the 4° position.
 John Williams answered .
2025-11-20
John Williams answered .
2025-11-20
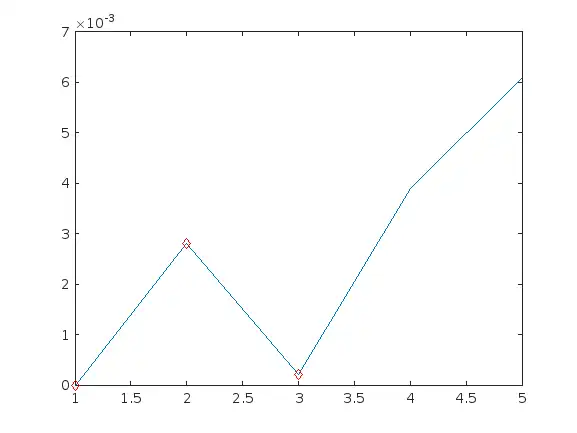
a =[0;0.0028;0.0002;0.0039;0.0061];
id = find(islocalmin(a(1:end)));
a_keep = a(1:id)
a_keep = 3×1
         0
    0.0028
    0.0002
plot(a)
hold on
plot(a_keep,'dr')