What would be the equation of the following surface?

I have the raw data of X, Y, Z, where X and Y are inputs and Z is the output. Plotting the surface gives the red curve in the below picture: The surface seems to be a simple function involving trigonometric functions. For example, plotting the equation cos(X)^2 + cos(Y)^2 gives the blue surface and it looks similar to the red graph (but the RMS error is very large). I have tried introducing variables (a1*cos(X)^2 + a2*cos(Y)^2), where a1 and a2 vary from 0 to 1) but the RMS error is still large. I also tried the surface fitting functions (MATLAB's fit function) but it's models are limited (unlike the curve fitting models which include Fourier series, sin series, etc). How can I find the equation which gives the red surface? Edit for clarity: I am able to use the lsqcurvefit (or any other curve fitting toolbox functions) to find which coefficients to use, but I am not sure what the equation should be. cos(X)^2 + cos(Y)^2, for example, is not the right equation but it does have a similar shape. If this seems improbabilistic, how can I vary cos(X)^2 + cos(Y)^2 to align the end curves of the surface (where there seems to be highest misalignment)?
 Prashant Kumar answered .
2025-11-20
Prashant Kumar answered .
2025-11-20
 , where
  so that it fits the local data.
[X, Y] = meshgrid(-1:0.05:1);
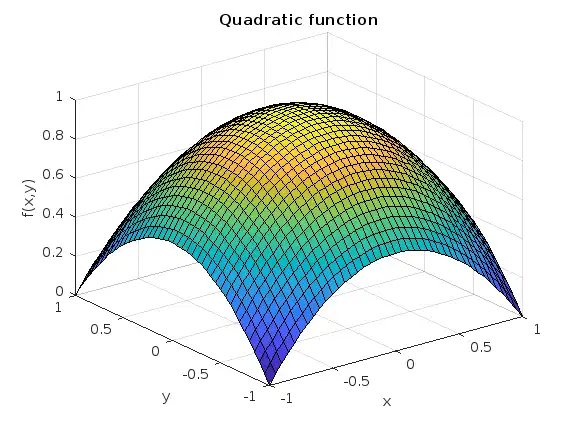
%% Polynomial function
c = 1;
b = 1/2;
a = b;
Z = c - b*Y.^2 - a*X.^2; % can try higher-order polynomial functions
surf(X, Y, Z), grid on
title('Quadratic function'), xlabel x, ylabel y, zlabel f(x,y)
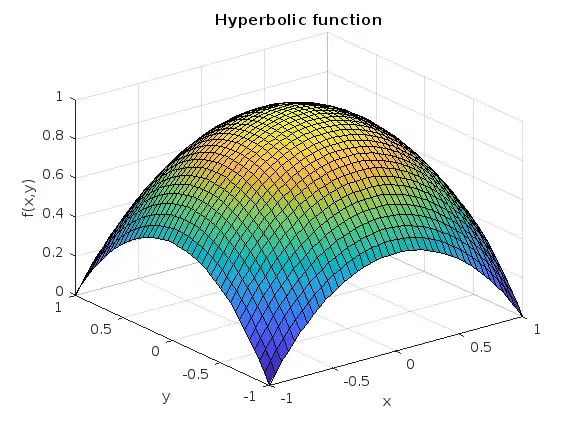
%% Hyperbolic function
c      = 1/(1 - sech(1));
b      = [1, (c*sech(1))/2];
a      = b;
Z      = c - b(2)*cosh(b(1)*Y) - a(2)*cosh(a(1)*X);
surf(X, Y, Z), grid on
title('Hyperbolic function'), xlabel x, ylabel y, zlabel f(x,y)
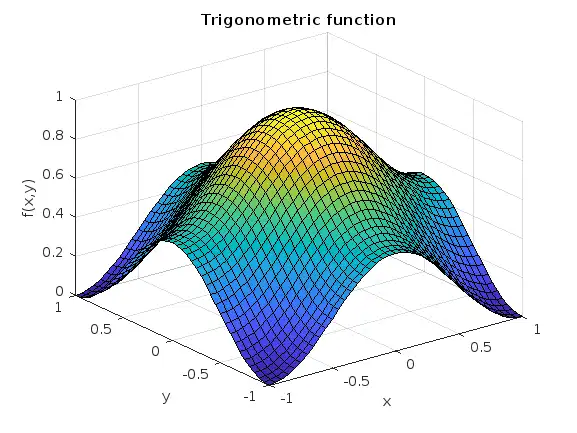
%% Trigonometric function (local)
c      = 0;
b      = [pi/2, 1/2];
a      = b;
Z      = c + b(2)*cos(b(1)*Y).^2 + a(2)*cos(a(1)*X).^2;
surf(X, Y, Z), grid on
title('Trigonometric function'), xlabel x, ylabel y, zlabel f(x,y)
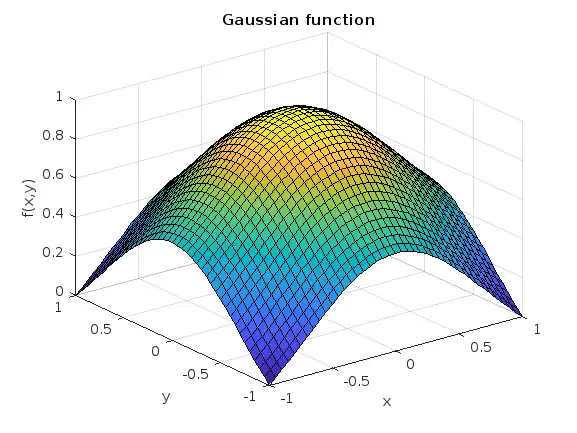
%% Gaussian function (local)
c      = 1/(1 - exp(1));
b      = exp(1)/(2*(exp(1) - 1));
a      = b;
Z      = c + b*exp(-Y.^2) + a*exp(-X.^2);   % can sech(x) if you like single-hump functions
surf(X, Y, Z), grid on
title('Gaussian function'), xlabel x, ylabel y, zlabel f(x,y)