Question
Hello, I am fitting some realively simple data with a log normal distribution. I am then generating a probability distribution from that fit. Shouldn't this roughly match the intial data? when I plot it on top of normalized histogram of the data, the shape is appropriate but the scale is about ten-fold lower. Example below. parmat = lognfit(data) pdf = lognpdf(0:1:1000,parmat(1),parmat(2)) figure;hold on histogram(data,[0:1:1000],'normalization','probability') plot(0:1:1000,pdf) In this case shouldn't the probability density function approximate the histrogam, rather than being one tenth or less the values of the histogram probability?
Expert Answer

Prashant Kumar
PhD Expert
Answered Oct 6, 2026
Consider thisexample:
X = lognrnd(0,1,[1,1000]);
histogram(X,100,'normalization','probability')
hold on
ezplot(@(x) lognpdf(x,0,1))
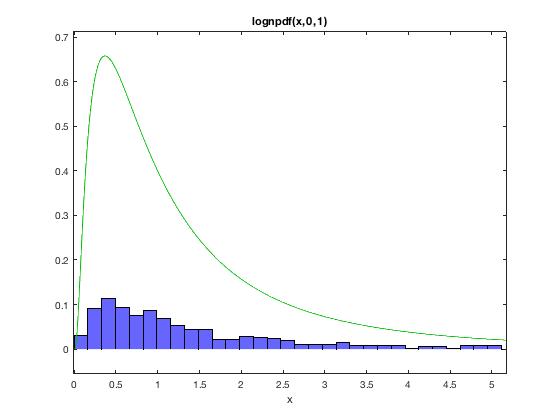
So the two plots seems scaled wrong.
But the histogram normlization chosen was one such that the sum of the bars is 1. Consider the choices given though.
ezplot(@(x) lognpdf(x,0,1))
hold on
histogram(X,100,'normalization','pdf')
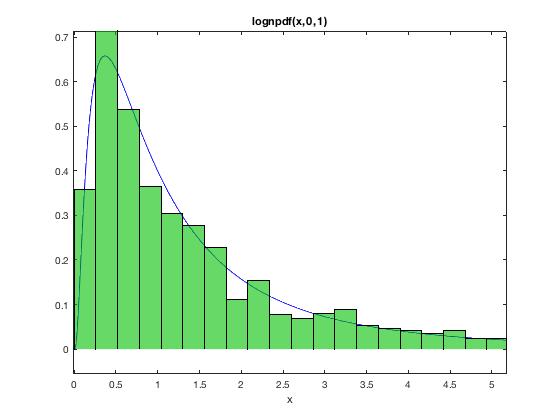
You made what may have seemed a reasonable choice in your normailzation, but the wrong one in hindsight.
Remember that a PDF does not contain actual probabilities, something that is a source of frequent consternation for some people when someone sees a PDF that returns numbers greater than 1.
100% Run Guarantee
3-Hour Fast-Track Delivery
Need a Custom Version or Complete Simulation for This Problem?
Our 500+ PhD engineers build, debug, and optimize working MATLAB scripts and Simulink (.slx) models tailored to your exact assignment rubrics with zero plagiarism.
Tested on MATLAB R2024b / R2026a
Turnitin 0% Plagiarism Report
Free 7-Day Revisions Guarantee
Have a different question? Ask here
Related lognpdf Questions & Solutions
Browse All →
Explore similar technical troubleshooting questions and verified MATLAB solutions:
Ready-to-Run MATLAB & Simulink Projects
Browse All Projects →