
y = cdf('Lognormal', S_y, S_var, S_mean);    % your code, incorrect
y = cdf('Lognormal', S_y, S_mean, S_var);    % correct
2) This is just a suggestion but it's a bit cleaner to use the makedist() function rather than entering the parameters manually into cdf().
doc cdf

pd = makedist('Lognormal', 'mu', S_mean, 'sigma', S_var);
y = cdf(pd, S_y);   % instead of cdf('Lognormal', S_y, S_mean, S_var)
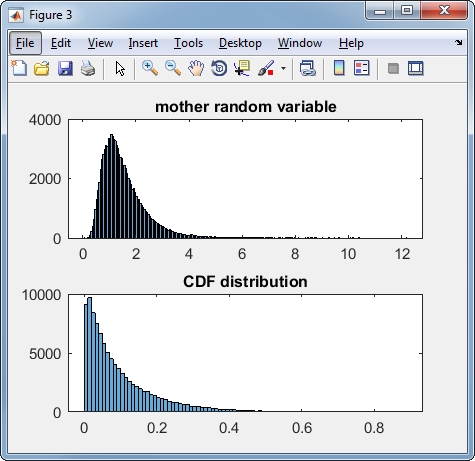
3) " when I compare my data set with itself, Its result shows me they don't have same distribution." But you aren't comparing your data with itself. You're comparing your data with the results of the cumulative distribution function of your data. The plot below shows the distribution of values from your data (top) and the distribution of values from the CDF. Clearly those distributions differ and the kstest() correctly rejects the null hypothesis.
figure
subplot(2,1,1)
histogram(S_y)
title('mother random variable')
subplot(2,1,2)
histogram(cdf('Lognormal', S_y, S_mean, S_var))
title('CDF distribution')
Need a Custom Version or Complete Simulation for This Problem?
Our 500+ PhD engineers build, debug, and optimize working MATLAB scripts and Simulink (.slx) models tailored to your exact assignment rubrics with zero plagiarism.
Explore similar technical troubleshooting questions and verified MATLAB solutions: