Abstract
In the financial market, there are a large number of indicators used to describe the change of
stock price, which provides a good data basis for our stock price forecast. Different stocks are
affected by different factors due to their different industry types and regions. Therefore, it
is very important to find a multi factor combination suitable for a particular stock to predict
the price of the stock. This paper proposes to use Genetic Algorithm(GA) for feature selection
and develop an optimized Long Short-Term Memory(LSTM) neural network stock prediction model.
Firstly, we use the GA to obtain a factors importance ranking. Then, the optimal combination of
factors is obtained from this ranking with the method of trial and error. Finally, we use the
combination of optimal factors and LSTM model for stock prediction. Thorough empirical studies
based upon the China construction bank dataset and the CSI 300 stock dataset demonstrate that
the GA-LSTM model can outperform all baseline models for time series prediction.
Introduction
Buying and selling stocks is a very interesting thing. Because stocks can make investors get big
profits, but vice versa. To get a big profit, investors need to analyze in predicting stock
prices. However, predicting stock prices is a difficult thing to do because stock prices
fluctuate rapidly all the time. So that investors need to predict the stock price as short as
possible.
Genetic Algorithm or GA is a metaheuristic inspired by the process of natural
selection that belongs to the larger class of Evolutionary Algorithms (EA). Genetic algorithms
are commonly used to generate high-quality solutions to optimization and search problems by
relying on biologically inspired operators such as mutation, crossover, and selection.

Related Work
GA is search algorithm based on the mechanics of natural selection and genetics and they combine
survival of the fittest among string structures to form a search algorithm (L. Davis, 1991). GA
is particularly suitable for multi-parameter optimization problems with an objective function
subject to numerous hard and soft constraints. The main idea of GA is to start with a population
of solutions to a problem, and attempt to produce new generations of solutions which are better
than the previous ones. GA operates through a simple cycle consisting of the following four
stages: initialization, selection, crossover, and mutation. Figure shows the basic steps of
proposed genetic algorithms model.
Trading Rule
Although there are an infinite number of possible rules by which we could trade, it seems that
only a few of them would have made a profit. To find the rule that would have yielded the most
profit had it been used to trade stocks on a given set of historical data, firstly, we develop
trading rules of this general form is as shown below.
General form of trading rules
- If today’s value of the indicator 1 is greater than or equal to (less than) A1,
- And change since the last day’s value of the indicator 2 is Greater than or equal to (less
than) A2,
-
And last day’s value of the indicator 3 is greater than or equal to (less than) A3
-
And last day’s value of the indicator 4 is greater than or equal to (less than) A4,
-
And last day’s value of the indicator 5 is greater than or equal to (less than) A5,
-
And today’s value of the indicator 6 is greater than or equal to (less than) A6,
There are five conditions that are evaluated for each trading day. If the all of five conditions
are satisfied, then the model will produce ‘buy’ signal on that day, otherwise it will suggest
‘sell.’ A1 to A6 denotes the cutoff values. The cutoff values range from 0 to 1, and represent
the percentage of the data source's range. For example, if RSI (relative strength index) ranges
from 0 to 100, then a cutoff value of 0.0 would match a RSI of 0, a cutoff value of 1.0 would
match a RSI of 100, and a cutoff value of 0.5 would match a RSI of 50. This allows the rules to
refer to any data source, regardless of the values it takes on. We consider additional
flexibility regarding the indicator component of the rule structure such as ‘today’s value,’
‘last day’s value,’ and ‘change since the last day’s value.’ Translating this in its full form,
for example, would yield the following statement:
Trading rules
-
If today’s value of ROC is greater than or equal to 30.0,
-
And change since the last day’s value of RSI is less than 60.0,
-
And last day’s value of stochastic %D is less than 51.0,
-
And last day’s value of A/D oscillator is less than 12.5,
-
And last day’s value of MACD is less than 14.9,
-
And today’s value of stochastic %K is less than 75.9,
Then buy else sell
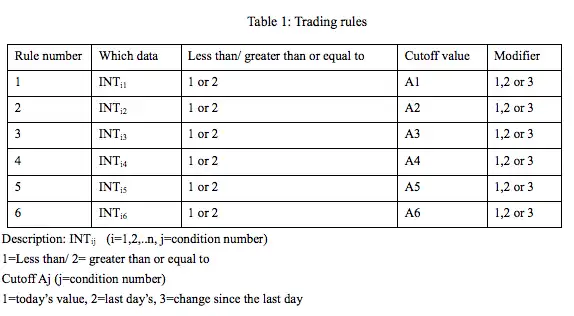
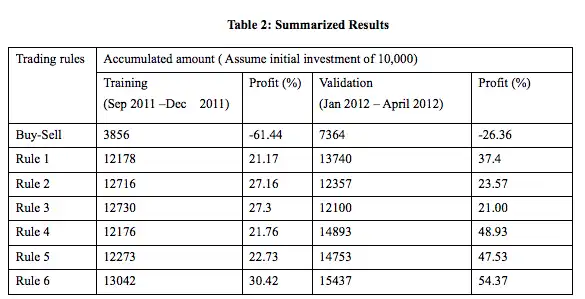
Above rule structure is summarized in Table 1. In Table 1, ‘which data’ means data source the
rule refers to, and ‘modifier’ means a modifier value that determines if the value itself should
be examined, or if the last day's value or the change since the last day should be examined.
There has been much debate regarding the development of trading system using historical data. We
agree that the future is never exactly like the past; however, a common investment approach is
to employ systems that would probably have worked well in the past and that seem to have a
reasonable chance of doing well in the future. So, we define a goal of the system as finding a
rule which would have yielded the highest return over a certain time period.