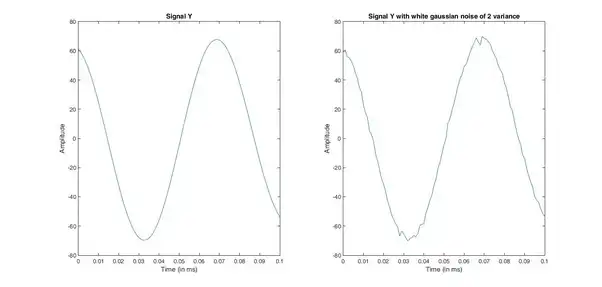
You are suppose to add “White gaussian noise of 2 variance”…..
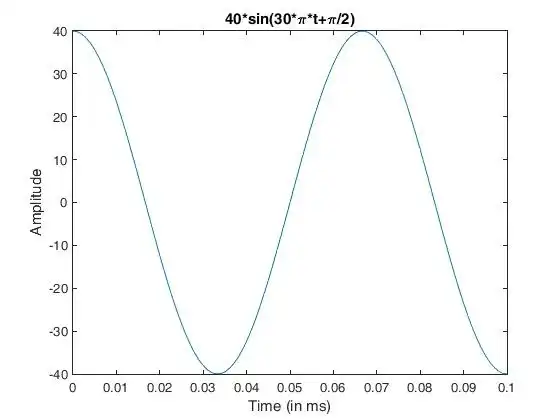
Signal a
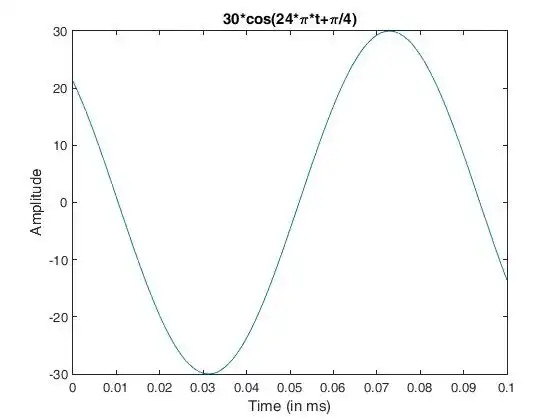
 Signal b
 Signal Y with and without noise
 MATLAB Code
clc
clear
close all
fs=1000; % sampling frequency 1kHz
ts=1/fs; % sampling time
ms=1e-3; % define a variable ms
time=100*ms; % duration of signal
t=0:ts:time; % generate time samples with interval of ms
a=40*sin(30*pi*t+(pi/2)); % signal a
b=30*cos(24*pi*t+(pi/4)); % signal b
% Plot signal a
plot(t,a)
xlabel('Time (in ms)')
ylabel('Amplitude')
title('40*sin(30*\pi*t+\pi/2)')
% Plot signal b
figure
plot(t,b)
xlabel('Time (in ms)')
ylabel('Amplitude') title('30*cos(24*\pi*t+\pi/4)')
% Generate signal y
y=a+b;
% add white noise of variance 2
y1=y+sqrt(2)*randn(size(a));
figure,
subplot(121)
plot(t,y)
xlabel('Time (in ms)')
ylabel('Amplitude')
title('Signal Y')
subplot(122)
plot(t,y1)
xlabel('Time (in ms)')
ylabel('Amplitude')
title('Signal Y with white gaussian noise of 2 variance')
clear
close all
fs=1000; % sampling frequency 1kHz
ts=1/fs; % sampling time
ms=1e-3; % define a variable ms
time=100*ms; % duration of signal
t=0:ts:time; % generate time samples with interval of ms
a=40*sin(30*pi*t+(pi/2)); % signal a
b=30*cos(24*pi*t+(pi/4)); % signal b
% Plot signal a
plot(t,a)
xlabel('Time (in ms)')
ylabel('Amplitude')
title('40*sin(30*\pi*t+\pi/2)')
% Plot signal b
figure
plot(t,b)
xlabel('Time (in ms)')
ylabel('Amplitude') title('30*cos(24*\pi*t+\pi/4)')
% Generate signal y
y=a+b;
% add white noise of variance 2
y1=y+sqrt(2)*randn(size(a));
figure,
subplot(121)
plot(t,y)
xlabel('Time (in ms)')
ylabel('Amplitude')
title('Signal Y')
subplot(122)
plot(t,y1)
xlabel('Time (in ms)')
ylabel('Amplitude')
title('Signal Y with white gaussian noise of 2 variance')