Classification Using Nearest Neighbors 3

Classify Query Data

This example shows how to classify query data by:

  1. Growing a Kd-tree

  2. Conducting a k nearest neighbor search using the grown tree.

  3. Assigning each query point the class with the highest representation among their respective nearest neighbors.

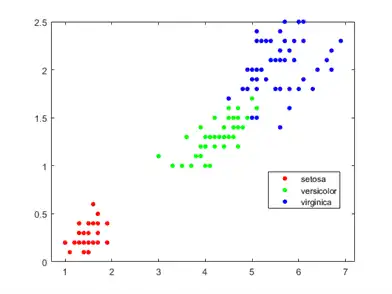
Classify a new point based on the last two columns of the Fisher iris data. Using only the last two columns makes it easier to plot.

load fisheriris
x = meas(:,3:4);
gscatter(x(:,1),x(:,2),species)
legend('Location','best')
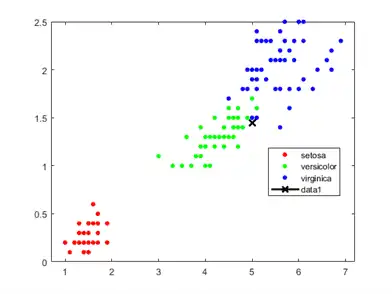
Figure contains an axes object. The axes object contains 3 objects of type line. These objects represent setosa, versicolor, virginica.

Plot the new point.

newpoint = [5 1.45];
line(newpoint(1),newpoint(2),'marker','x','color','k',...
   'markersize',10,'linewidth',2)

Figure contains an axes object. The axes object contains 4 objects of type line. These objects represent setosa, versicolor, virginica.

Prepare a Kd-tree neighbor searcher model.

Mdl = KDTreeSearcher(x)
Mdl = 
  KDTreeSearcher with properties:

       BucketSize: 50
         Distance: 'euclidean'
    DistParameter: []
                X: [150x2 double]

Mdl is a KDTreeSearcher model. By default, the distance metric it uses to search for neighbors is Euclidean distance.

Find the 10 sample points closest to the new point.

[n,d] = knnsearch(Mdl,newpoint,'k',10);
line(x(n,1),x(n,2),'color',[.5 .5 .5],'marker','o',...
    'linestyle','none','markersize',10)

Figure contains an axes object. The axes object contains 5 objects of type line. These objects represent setosa, versicolor, virginica.

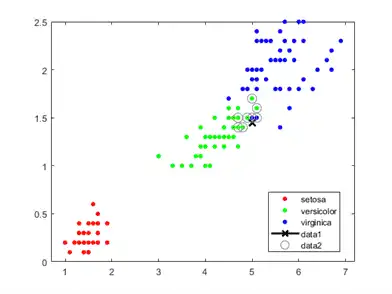
It appears that knnsearch has found only the nearest eight neighbors. In fact, this particular dataset contains duplicate values.

x(n,:)
ans = 10×2

    5.0000    1.5000
    4.9000    1.5000
    4.9000    1.5000
    5.1000    1.5000
    5.1000    1.6000
    4.8000    1.4000
    5.0000    1.7000
    4.7000    1.4000
    4.7000    1.4000
    4.7000    1.5000

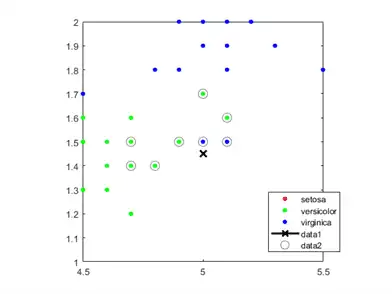
Make the axes equal so the calculated distances correspond to the apparent distances on the plot axis equal and zoom in to see the neighbors better.

xlim([4.5 5.5]);
ylim([1 2]);
axis square

Figure contains an axes object. The axes object contains 5 objects of type line. These objects represent setosa, versicolor, virginica.

Find the species of the 10 neighbors.

tabulate(species(n))
       Value    Count   Percent
   virginica        2     20.00%
  versicolor        8     80.00%

Using a rule based on the majority vote of the 10 nearest neighbors, you can classify this new point as a versicolor.

Visually identify the neighbors by drawing a circle around the group of them. Define the center and diameter of a circle, based on the location of the new point.

ctr = newpoint - d(end);
diameter = 2*d(end);
% Draw a circle around the 10 nearest neighbors.
h = rectangle('position',[ctr,diameter,diameter],...
   'curvature',[1 1]);
h.LineStyle = ':';

Figure contains an axes object. The axes object contains 6 objects of type line, rectangle. These objects represent setosa, versicolor, virginica.

Using the same dataset, find the 10 nearest neighbors to three new points.

figure 
newpoint2 = [5 1.45;6 2;2.75 .75];
gscatter(x(:,1),x(:,2),species)
legend('location','best')
[n2,d2] = knnsearch(Mdl,newpoint2,'k',10);
line(x(n2,1),x(n2,2),'color',[.5 .5 .5],'marker','o',...
   'linestyle','none','markersize',10)
line(newpoint2(:,1),newpoint2(:,2),'marker','x','color','k',...
   'markersize',10,'linewidth',2,'linestyle','none')

Figure contains an axes object. The axes object contains 5 objects of type line. These objects represent setosa, versicolor, virginica.

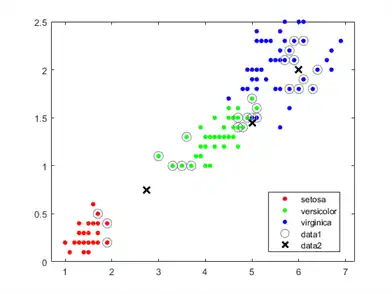
Find the species of the 10 nearest neighbors for each new point.

tabulate(species(n2(1,:)))
       Value    Count   Percent
   virginica        2     20.00%
  versicolor        8     80.00%
tabulate(species(n2(2,:)))
      Value    Count   Percent
  virginica       10    100.00%
tabulate(species(n2(3,:)))
       Value    Count   Percent
  versicolor        7     70.00%
      setosa        3     30.00%

For more examples using knnsearch methods and function, see the individual reference pages.


Matlabsolutions.com provides guaranteed satisfaction with a commitment to complete the work within time. Combined with our meticulous work ethics and extensive domain experience, We are the ideal partner for all your homework/assignment needs. We pledge to provide 24*7 support to dissolve all your academic doubts. We are composed of 300+ esteemed Matlab and other experts who have been empanelled after extensive research and quality check.

Matlabsolutions.com provides undivided attention to each Matlab assignment order with a methodical approach to solution. Our network span is not restricted to US, UK and Australia rather extends to countries like Singapore, Canada and UAE. Our Matlab assignment help services include Image Processing Assignments, Electrical Engineering Assignments, Matlab homework help, Matlab Research Paper help, Matlab Simulink help. Get your work done at the best price in industry.

Machine Learning in MATLAB

Train Classification Models in Classification Learner App

Train Regression Models in Regression Learner App

Distribution Plots

Explore the Random Number Generation UI

Design of Experiments

Machine Learning Models

Logistic regression

Logistic regression create generalized linear regression model - MATLAB fitglm 2

Support Vector Machines for Binary Classification

Support Vector Machines for Binary Classification 2

Support Vector Machines for Binary Classification 3

Support Vector Machines for Binary Classification 4

Support Vector Machines for Binary Classification 5

Assess Neural Network Classifier Performance

Naive Bayes Classification

ClassificationTree class

Discriminant Analysis Classification

Ensemble classifier

ClassificationTree class 2

Train Generalized Additive Model for Binary Classification

Train Generalized Additive Model for Binary Classification 2

Classification Using Nearest Neighbors

Classification Using Nearest Neighbors 2

Classification Using Nearest Neighbors 3

Classification Using Nearest Neighbors 4

Classification Using Nearest Neighbors 5

Linear Regression

Linear Regression 2

Linear Regression 3

Linear Regression 4

Nonlinear Regression

Nonlinear Regression 2

Visualizing Multivariate Data

Generalized Linear Models

Generalized Linear Models 2

RegressionTree class

RegressionTree class 2

Neural networks

Gaussian Process Regression Models

Gaussian Process Regression Models 2

Understanding Support Vector Machine Regression

Understanding Support Vector Machine Regression 2

RegressionEnsemble