ClassificationTree class 2

Copy Semantics

Value. To learn how value classes affect copy operations, 

Examples

Grow a Classification Tree

Grow a classification tree using the ionosphere data set.

load ionosphere
tc = fitctree(X,Y)
tc = 
  ClassificationTree
             ResponseName: 'Y'
    CategoricalPredictors: []
               ClassNames: {'b'  'g'}
           ScoreTransform: 'none'
          NumObservations: 351


  Properties, Methods

Control Tree Depth

You can control the depth of the trees using the MaxNumSplitsMinLeafSize, or MinParentSize name-value pair parameters. fitctree grows deep decision trees by default. You can grow shallower trees to reduce model complexity or computation time.

Load the ionosphere data set.

load ionosphere

The default values of the tree depth controllers for growing classification trees are:

  • n - 1 for MaxNumSplitsn is the training sample size.

  • 1 for MinLeafSize.

  • 10 for MinParentSize.

These default values tend to grow deep trees for large training sample sizes.

Train a classification tree using the default values for tree depth control. Cross-validate the model by using 10-fold cross-validation.

rng(1); % For reproducibility
MdlDefault = fitctree(X,Y,'CrossVal','on');

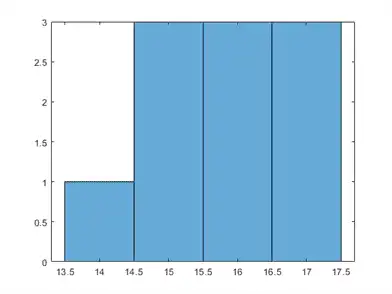
Draw a histogram of the number of imposed splits on the trees. Also, view one of the trees.

numBranches = @(x)sum(x.IsBranch);
mdlDefaultNumSplits = cellfun(numBranches, MdlDefault.Trained);

figure;
histogram(mdlDefaultNumSplits)

Figure contains an axes object. The axes object contains an object of type histogram.

view(MdlDefault.Trained{1},'Mode','graph')

Figure Classification tree viewer contains an axes object and other objects of type uimenu, uicontrol. The axes object contains 51 objects of type line, text.

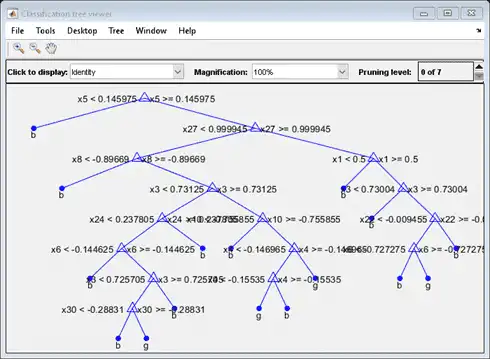
The average number of splits is around 15.

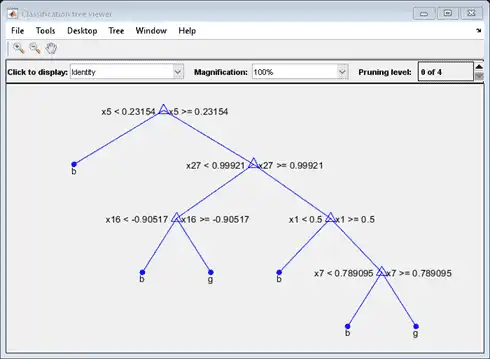
Suppose that you want a classification tree that is not as complex (deep) as the ones trained using the default number of splits. Train another classification tree, but set the maximum number of splits at 7, which is about half the mean number of splits from the default classification tree. Cross-validate the model by using 10-fold cross-validation.

Mdl7 = fitctree(X,Y,'MaxNumSplits',7,'CrossVal','on');
view(Mdl7.Trained{1},'Mode','graph')

Figure Classification tree viewer contains an axes object and other objects of type uimenu, uicontrol. The axes object contains 21 objects of type line, text.

Compare the cross-validation classification errors of the models.

classErrorDefault = kfoldLoss(MdlDefault)
classErrorDefault = 0.1168
classError7 = kfoldLoss(Mdl7)
classError7 = 0.1311

Mdl7 is much less complex and performs only slightly worse than MdlDefault.

More About

A decision tree splits nodes based on either impurity or node error.

Impurity means one of several things, depending on your choice of the SplitCriterion name-value pair argument:

  • Gini's Diversity Index (gdi) — The Gini index of a node is

    1?ip2(i),

    where the sum is over the classes i at the node, and p(i) is the observed fraction of classes with class i that reach the node. A node with just one class (a pure node) has Gini index 0; otherwise the Gini index is positive. So the Gini index is a measure of node impurity.

  • Deviance ('deviance') — With p(i) defined the same as for the Gini index, the deviance of a node is

    ?ip(i)log2p(i).

    A pure node has deviance 0; otherwise, the deviance is positive.

  • Twoing rule ('twoing') — Twoing is not a purity measure of a node, but is a different measure for deciding how to split a node. Let L(i) denote the fraction of members of class i in the left child node after a split, and R(i) denote the fraction of members of class i in the right child node after a split. Choose the split criterion to maximize

    P(L)P(R)(?i?L(i)R(i)?)2,

    where P(L) and P(R) are the fractions of observations that split to the left and right respectively. If the expression is large, the split made each child node purer. Similarly, if the expression is small, the split made each child node similar to each other, and therefore similar to the parent node. The split did not increase node purity.

  • Node error — The node error is the fraction of misclassified classes at a node. If j is the class with the largest number of training samples at a node, the node error is

    1 – p(j).

Matlabsolutions.com provides guaranteed satisfaction with a commitment to complete the work within time. Combined with our meticulous work ethics and extensive domain experience, We are the ideal partner for all your homework/assignment needs. We pledge to provide 24*7 support to dissolve all your academic doubts. We are composed of 300+ esteemed Matlab and other experts who have been empanelled after extensive research and quality check.

Matlabsolutions.com provides undivided attention to each Matlab assignment order with a methodical approach to solution. Our network span is not restricted to US, UK and Australia rather extends to countries like Singapore, Canada and UAE. Our Matlab assignment help services include Image Processing Assignments, Electrical Engineering Assignments, Matlab homework help, Matlab Research Paper help, Matlab Simulink help. Get your work done at the best price in industry.

Machine Learning in MATLAB

Train Classification Models in Classification Learner App

Train Regression Models in Regression Learner App

Distribution Plots

Explore the Random Number Generation UI

Design of Experiments

Machine Learning Models

Logistic regression

Logistic regression create generalized linear regression model - MATLAB fitglm 2

Support Vector Machines for Binary Classification

Support Vector Machines for Binary Classification 2

Support Vector Machines for Binary Classification 3

Support Vector Machines for Binary Classification 4

Support Vector Machines for Binary Classification 5

Assess Neural Network Classifier Performance

Naive Bayes Classification

ClassificationTree class

Discriminant Analysis Classification

Ensemble classifier

ClassificationTree class 2

Train Generalized Additive Model for Binary Classification

Train Generalized Additive Model for Binary Classification 2

Classification Using Nearest Neighbors

Classification Using Nearest Neighbors 2

Classification Using Nearest Neighbors 3

Classification Using Nearest Neighbors 4

Classification Using Nearest Neighbors 5

Linear Regression

Linear Regression 2

Linear Regression 3

Linear Regression 4

Nonlinear Regression

Nonlinear Regression 2

Visualizing Multivariate Data

Generalized Linear Models

Generalized Linear Models 2

RegressionTree class

RegressionTree class 2

Neural networks

Gaussian Process Regression Models

Gaussian Process Regression Models 2

Understanding Support Vector Machine Regression

Understanding Support Vector Machine Regression 2

RegressionEnsemble