Creating Colorbars

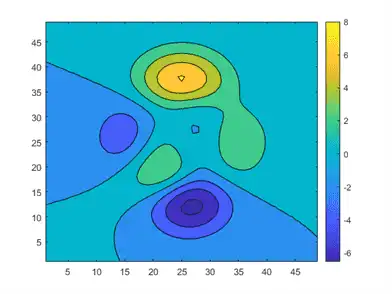
Colorbars allow you to see the relationship between your data and the colors displayed in your chart. After you have created a colorbar, you can customize different aspects of its appearance, such as its location, thickness, and tick labels. For example, this colorbar shows the relationship between the values of the peaks function and the colors shown in the plot next to it.

contourf(peaks)
c = colorbar;

The default location of the colorbar is on the right side of the axes. However, you can move the colorbar to a different location by setting the Location property. In this case, the 'southoutside' option places the colorbar below the axes.

c.Location = 'southoutside';

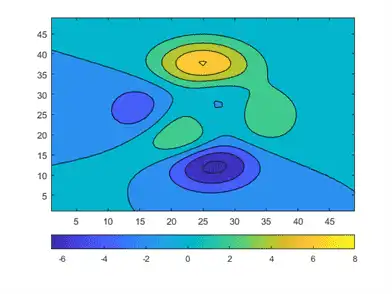
You can also change the thickness of the colorbar. The Position property controls the location and size of most graphics objects, including axes and colorbars. Because this colorbar is horizontal, the fourth value in c.Position (which corresponds to height) controls its thickness. Here, the colorbar is narrowed and the axes position is reset so that there is no overlap with the colorbar.

ax = gca;
axpos = ax.Position;
c.Position(4) = 0.5*c.Position(4);
ax.Position = axpos;

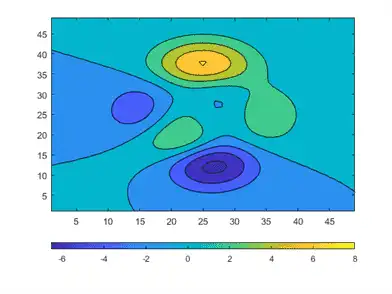
Colorbar objects have several properties for modifying the tick spacing and labels. For example, you can specify that the ticks occur in only three places: -6.50, and 8.

c.Ticks = [-6.5 0 8];

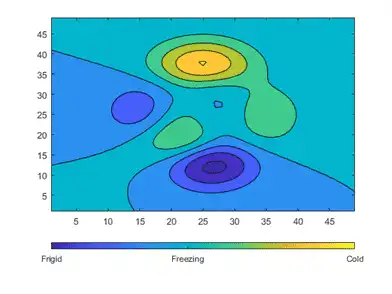
You can change the tick labels to any values. Use a cell array to specify the tick labels.

c.TickLabels = {'Frigid','Freezing','Cold'};

You can also use TeX or LaTeX markup. Use the TickLabelInterpreter property to set the interpreter when you use TeX or LaTeX.

c.TickLabelInterpreter = 'tex';
c.TickLabels = {'-6.5\circ','0\circ','8\circ'};

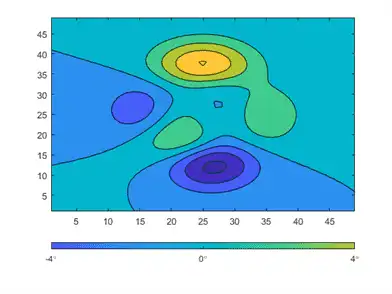
You can change the limits of the colorbar to focus on a specific region of color. For example, you can narrow the limits and adjust the tick labels to reflect the new limits. The resulting colorbar excludes the dark blue shades that used to be on the left and the yellow shades that used to be on the right.

c.Limits = [-4 4];
c.Ticks = [-4 0 4];
c.TickLabels = {'-4\circ','0\circ','4\circ'};

Add a descriptive label to the colorbar using the Label property. Because the Label property must be specified as a Text object, you must set the String property of the Text object first. Then you can assign that Text object to the Label property. The following command accomplishes both tasks in one step.

c.Label.String = 'Degrees Celsius';

Matlabsolutions.com provides guaranteed satisfaction with a commitment to complete the work within time. Combined with our meticulous work ethics and extensive domain experience, We are the ideal partner for all your homework/assignment needs. We pledge to provide 24*7 support to dissolve all your academic doubts. We are composed of 300+ esteemed Matlab and other experts who have been empanelled after extensive research and quality check.

Matlabsolutions.com provides undivided attention to each Matlab assignment order with a methodical approach to solution. Our network span is not restricted to US, UK and Australia rather extends to countries like Singapore, Canada and UAE. Our Matlab assignment help services include Image Processing Assignments, Electrical Engineering Assignments, Matlab homework help, Matlab Research Paper help, Matlab Simulink help. Get your work done at the best price in industry.

Machine Learning in MATLAB

Train Classification Models in Classification Learner App

Train Regression Models in Regression Learner App

Distribution Plots

Explore the Random Number Generation UI

Design of Experiments

Machine Learning Models

Logistic regression

Logistic regression create generalized linear regression model - MATLAB fitglm 2

Support Vector Machines for Binary Classification

Support Vector Machines for Binary Classification 2

Support Vector Machines for Binary Classification 3

Support Vector Machines for Binary Classification 4

Support Vector Machines for Binary Classification 5

Assess Neural Network Classifier Performance

Naive Bayes Classification

ClassificationTree class

Discriminant Analysis Classification

Ensemble classifier

ClassificationTree class 2

Train Generalized Additive Model for Binary Classification

Train Generalized Additive Model for Binary Classification 2

Classification Using Nearest Neighbors

Classification Using Nearest Neighbors 2

Classification Using Nearest Neighbors 3

Classification Using Nearest Neighbors 4

Classification Using Nearest Neighbors 5

Linear Regression

Linear Regression 2

Linear Regression 3

Linear Regression 4

Nonlinear Regression

Nonlinear Regression 2

Visualizing Multivariate Data

Generalized Linear Models

Generalized Linear Models 2

RegressionTree class

RegressionTree class 2

Neural networks

Gaussian Process Regression Models

Gaussian Process Regression Models 2

Understanding Support Vector Machine Regression

Understanding Support Vector Machine Regression 2

RegressionEnsemble