How Image Data Relates to a Colormap

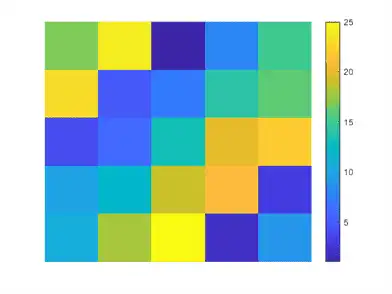
When you display images using the image function, you can control how the range of pixel values maps to the range of the colormap. For example, here is a 5-by-5 magic square displayed as an image using the default colormap.

A = magic(5) 
A = 5×5

    17    24     1     8    15
    23     5     7    14    16
     4     6    13    20    22
    10    12    19    21     3
    11    18    25     2     9

im = image(A);
axis off
colorbar

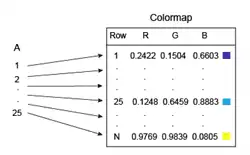
A contains values between 1 and 25. MATLAB® treats those values as indices into the colormap, which has 64 entries. Thus, all the pixels in the preceding image map to the first 25 entries in the colormap (roughly the blue region of the colorbar).

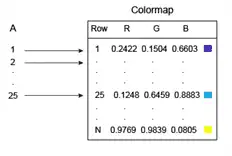
You can control this mapping with the CDataMapping property of the Image object. The default behavior shown in the preceding diagram corresponds to the 'direct' option for this property. Direct mapping is useful when you are displaying images (such as GIF images) that contain their own colormap. However, if your image represents measurements of some physical unit (e.g., meters or degrees) then set the CDataMapping property to 'scaled'. Scaled mapping uses the full range of colors, and it allows you to visualize the relative differences in your data.

im.CDataMapping = 'scaled';

The 'scaled' option maps the smallest value in A to the first entry in the colormap, and maps largest value in A maps to the last entry in the colormap. All intermediate values of A are linearly scaled to the colormap.

As an alternative to setting the CDataMapping property to 'scaled', you can call the imagesc function to get the same effect.

imagesc(A);
axis off
colorbar

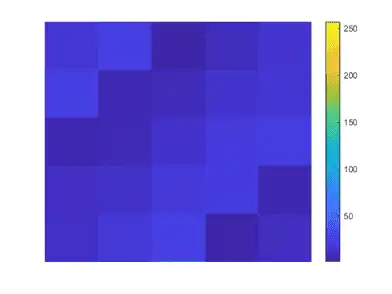
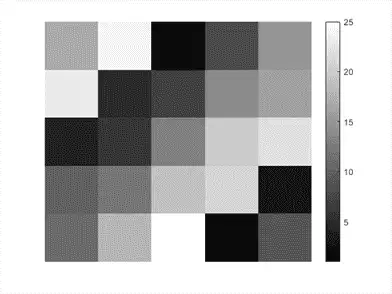
If you change the colormap, the values in A are scaled to the new colormap.

colormap(gray);

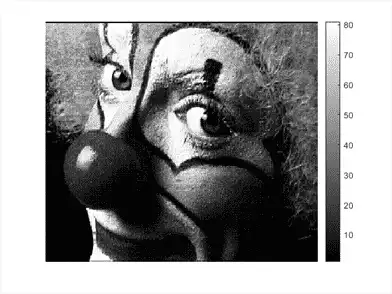
Scaled mapping is also useful for displaying pictorial images that have no colormap, or when you want to change the colormap for a pictorial image. The following commands display an image using the gray colormap, which is different than the original colormap that is stored with this image.

load clown
image(X,'CDataMapping','scaled');
colormap(gray);
axis off
colorbar

Matlabsolutions.com provides guaranteed satisfaction with a commitment to complete the work within time. Combined with our meticulous work ethics and extensive domain experience, We are the ideal partner for all your homework/assignment needs. We pledge to provide 24*7 support to dissolve all your academic doubts. We are composed of 300+ esteemed Matlab and other experts who have been empanelled after extensive research and quality check.

Matlabsolutions.com provides undivided attention to each Matlab assignment order with a methodical approach to solution. Our network span is not restricted to US, UK and Australia rather extends to countries like Singapore, Canada and UAE. Our Matlab assignment help services include Image Processing Assignments, Electrical Engineering Assignments, Matlab homework help, Matlab Research Paper help, Matlab Simulink help. Get your work done at the best price in industry.

Machine Learning in MATLAB

Train Classification Models in Classification Learner App

Train Regression Models in Regression Learner App

Distribution Plots

Explore the Random Number Generation UI

Design of Experiments

Machine Learning Models

Logistic regression

Logistic regression create generalized linear regression model - MATLAB fitglm 2

Support Vector Machines for Binary Classification

Support Vector Machines for Binary Classification 2

Support Vector Machines for Binary Classification 3

Support Vector Machines for Binary Classification 4

Support Vector Machines for Binary Classification 5

Assess Neural Network Classifier Performance

Naive Bayes Classification

ClassificationTree class

Discriminant Analysis Classification

Ensemble classifier

ClassificationTree class 2

Train Generalized Additive Model for Binary Classification

Train Generalized Additive Model for Binary Classification 2

Classification Using Nearest Neighbors

Classification Using Nearest Neighbors 2

Classification Using Nearest Neighbors 3

Classification Using Nearest Neighbors 4

Classification Using Nearest Neighbors 5

Linear Regression

Linear Regression 2

Linear Regression 3

Linear Regression 4

Nonlinear Regression

Nonlinear Regression 2

Visualizing Multivariate Data

Generalized Linear Models

Generalized Linear Models 2

RegressionTree class

RegressionTree class 2

Neural networks

Gaussian Process Regression Models

Gaussian Process Regression Models 2

Understanding Support Vector Machine Regression

Understanding Support Vector Machine Regression 2

RegressionEnsemble