This example shows how to lowpass filter a noisy signal in Simulink® and visualize the original and filtered signals with a spectrum analyzer. For a MATLAB® version of this example, see Filter Frames of a Noisy Sine Wave Signal in MATLAB.
Open Model
To create a new blank model and open the library browser:
-
On the MATLAB Home tab, click Simulink, and choose the Basic Filter model template.
-
Click Create Model to create a basic filter model opens with settings suitable for use with DSP System Toolbox™. To access the library browser, in the Simulation tab, click Library Browser on the model toolstrip.
The new model using the template settings and contents appears in the Simulink Editor. The model is only in memory until you save it.
Inspect Model
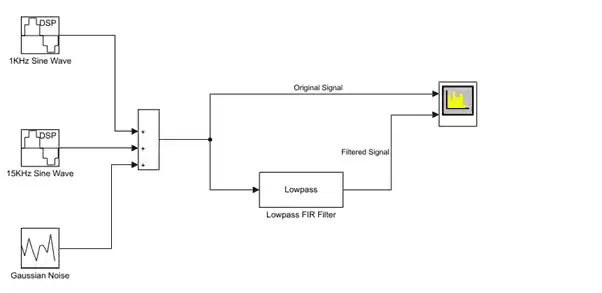
Input Signal
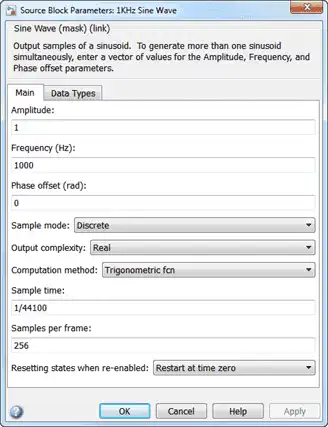
Three source blocks comprise the input signal. The input signal consists of the sum of two sine waves and white Gaussian noise with mean 0 and variance 0.05. The frequencies of the sine waves are 1 kHz and 15 kHz. The sampling frequency is 44.1 kHz. The dialog box shows the block parameters for the 1 kHz sine wave.
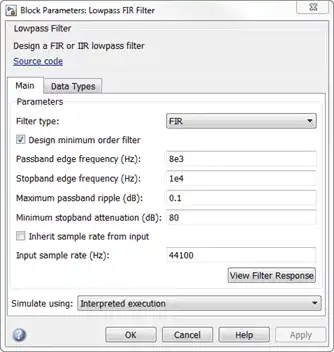
Lowpass Filter
The lowpass filter is modeled using a Lowpass Filter block. The example uses a generalized Remez FIR filter design algorithm. The filter has a passband frequency of 8000 Hz, a stopband frequency of 10,000 Hz, a passband ripple of 0.1 dB, and a stopband attenuation of 80 dB.
The Lowpass Filter block uses frame-based processing to process data one frame at a time. Each frame of data contains sequential samples from an independent channel. Frame-based processing is advantageous for many signal processing applications because you can process multiple samples at once. By buffering your data into frames and processing multisample frames of data, you can improve the computational time of your signal processing algorithms.
Compare Original and Filtered Signal
Use a Spectrum Analyzer to compare the power spectra of the original and filtered signals. The spectrum units are in dBm.
To run the simulation, in the model, click Run. To stop the simulation, in the Spectrum Analyzer block, click Stop. Alternatively, you can execute the following code to run the simulation for 200 frames of data.
set_param(model,'StopTime','256/44100 * 200')
sim(model);
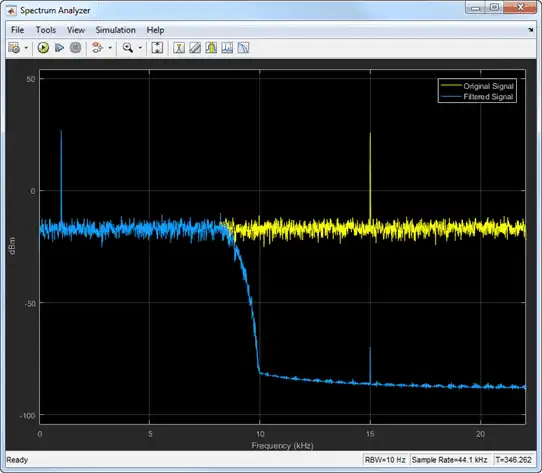
Frequencies above 10 kHz in the source signal are attenuated. The resulting signal maintains the peak at 1 kHz because it falls in the passband of the lowpass filter.