Load a datafile containing an echolocation pulse emitted by a big brown bat (Eptesicus fuscus) and measured with a sampling interval of 7 microseconds. Create a MATLAB® timetable using the signal and the time information.
load batsignal

t = (0:length(batsignal)-1)*DT;
sg = timetable(seconds(t)',batsignal);
Open Signal Analyzer and drag the timetable from the Workspace browser to the Signal table. Click Display Grid ? to create two side-by-side displays. Select each display and click the Time-Frequency button to add a spectrogram view.
Drag the timetable to both displays.
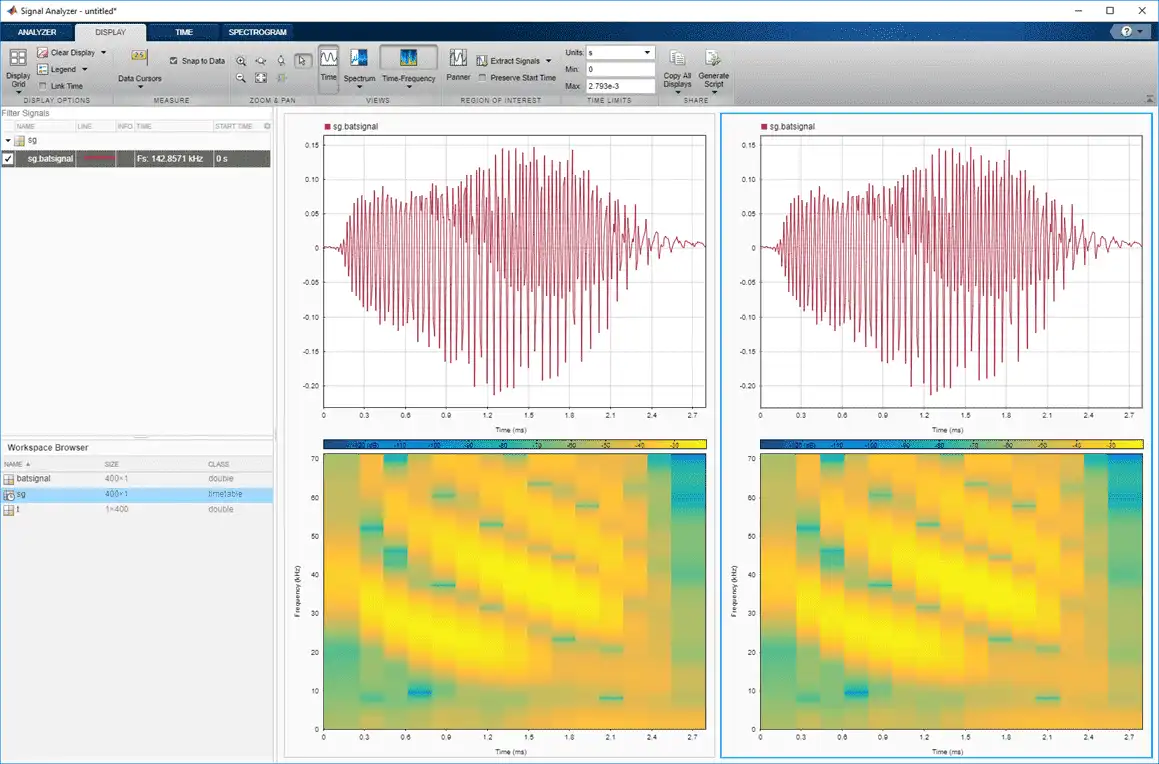
Select the Spectrogram tab. On the display at right, check Reassign. For each display:
-
Set the time resolution to 280 microseconds and specify 85% overlap between adjoining segments.
-
Use the Leakage slider to increase the leakage until the RBW is about 4.5 kHz.
-
Set the power limits to –45 dB and –20 dB.
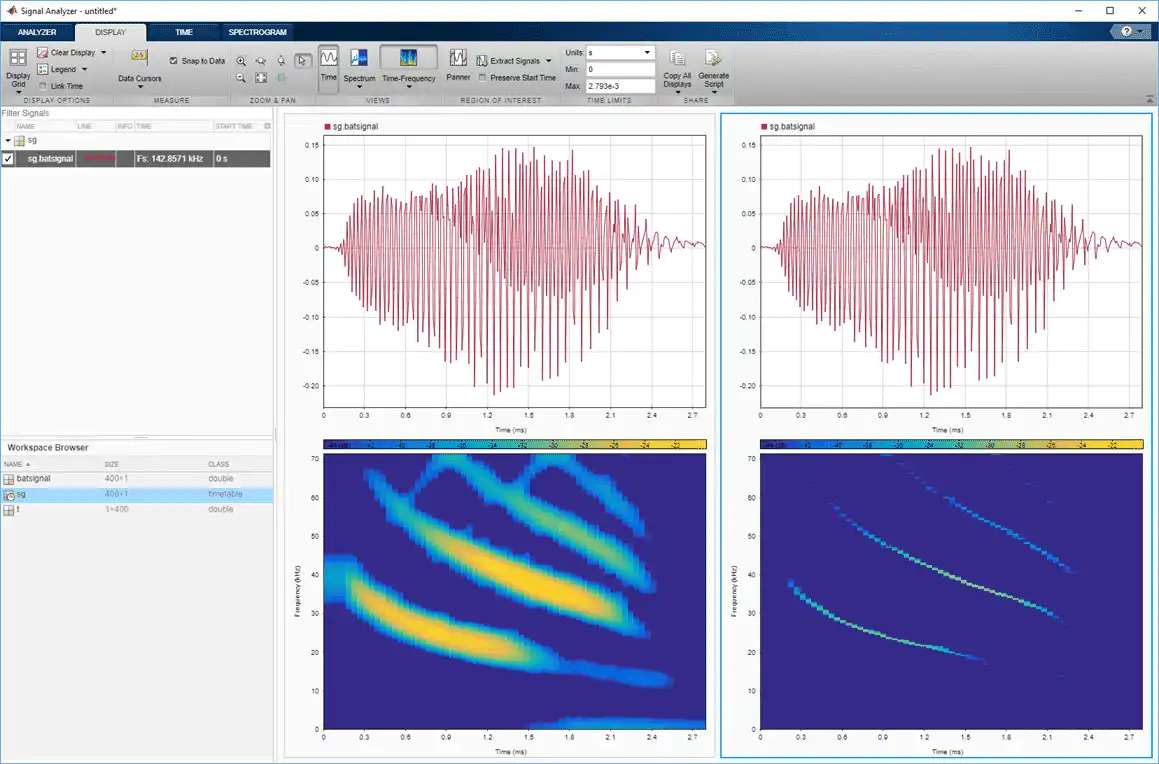
The reassigned spectrogram clearly shows three time-frequency ridges. To track the ridges, select the display at right. On the Display tab, click Generate Script and select Spectrogram Script. The script appears in the Editor.
% Compute spectrogram

% Generated by MATLAB(R) 9.7 and Signal Processing Toolbox 8.2.
% Generated on: 26-Dec-2018 17:21:44

% Parameters
timeLimits = seconds([0 0.002793]); % seconds
frequencyLimits = [0 71428.57]; % Hz
leakage = 0.9;
timeResolution = 0.00028; % seconds
overlapPercent = 85;
reassignFlag = true;

%%
% Index into signal time region of interest
sg_batsignal_ROI = sg(:,'batsignal');
sg_batsignal_ROI = sg_batsignal_ROI(timerange(timeLimits(1),timeLimits(2),'closed'),1);

% Compute spectral estimate
% Run the function call below without output arguments to plot the results
[P,F,T] = pspectrum(sg_batsignal_ROI, ...
    'spectrogram', ...
    'FrequencyLimits',frequencyLimits, ...
    'Leakage',leakage, ...
    'TimeResolution',timeResolution, ...
    'OverlapPercent',overlapPercent, ...
    'Reassign',reassignFlag);
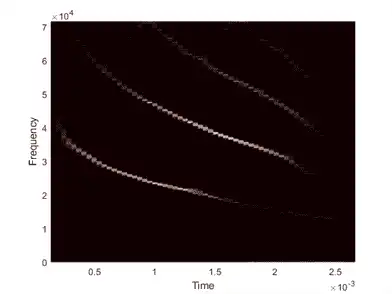
Run the script. Plot the reassigned spectrogram.
mesh(seconds(T),F,P)
xlabel('Time')
ylabel('Frequency')
axis tight
view(2)
colormap pink
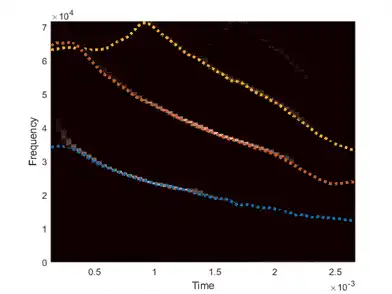
Use the tfridge function to track the ridges.
[fridge,~,lridge] = tfridge(P,F,0.01,'NumRidges',3,'NumFrequencyBins',10);

hold on
plot3(seconds(T),fridge,P(lridge),':','linewidth',3)
hold off
Thanks to Curtis Condon, Ken White, and Al Feng of the Beckman Center at the University of Illinois for the bat data and permission to use it in this example.