Use findpeaks to find values and locations of local maxima in a set of data.
The file spots_num.mat contains the average number of sunspots observed every year from 1749 to 2012. The data are available from NASA.
Find the maxima and their years of occurrence. Plot them along with the data.
load('spots_num.mat')

[pks,locs] = findpeaks(avSpots);

plot(year,avSpots,year(locs),pks,'or')
xlabel('Year')
ylabel('Number')
axis tight
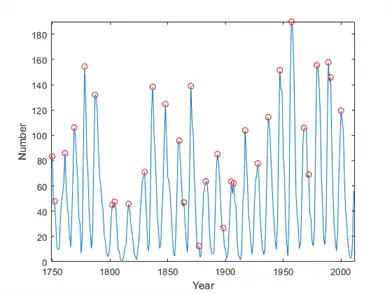
Some peaks are very close to each other. The ones that are not recur at regular intervals. There are roughly five such peaks per 50-year period.
To make a better estimate of the cycle duration, use findpeaks again, but this time restrict the peak-to-peak separation to at least six years. Compute the mean interval between maxima.
[pks,locs] = findpeaks(avSpots,'MinPeakDistance',6);

plot(year,avSpots,year(locs),pks,'or')
xlabel('Year')
ylabel('Number')
title('Sunspots')
axis tight

legend('Data','peaks','Location','NorthWest')
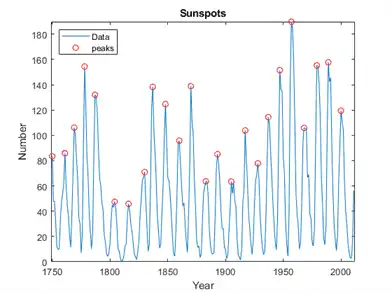
cycles = diff(locs);
meanCycle = mean(cycles)
meanCycle = 10.8696
It is well known that solar activity cycles roughly every 11 years. Check by using the Fourier transform. Remove the mean of the signal to concentrate on its fluctuations. Recall that the sample rate is measured in years. Use frequencies up to the Nyquist frequency.
Fs = 1;
Nf = 512;

df = Fs/Nf;
f = 0:df:Fs/2-df;

trSpots = fftshift(fft(avSpots-mean(avSpots),Nf));

dBspots = 20*log10(abs(trSpots(Nf/2+1:Nf)));

yaxis = [20 85];
plot(f,dBspots,1./[meanCycle meanCycle],yaxis)
xlabel('Frequency (year^{-1})')
ylabel('| FFT | (dB)')
axis([0 1/2 yaxis])
text(1/meanCycle + .02,25,['<== 1/' num2str(meanCycle)])
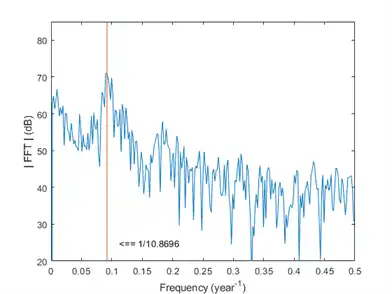
The Fourier transform indeed peaks at the expected frequency, confirming the 11-year conjecture. You also can find the period by locating the highest peak of the Fourier transform.
[pk,MaxFreq] = findpeaks(dBspots,'NPeaks',1,'SortStr','descend');

Period = 1/f(MaxFreq)
Period = 10.8936
hold on
plot(f(MaxFreq),pk,'or')
hold off
legend('Fourier transform','1/meanCycle','1/Period')
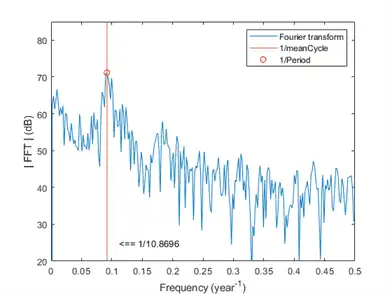
The two estimates coincide quite well.