This example shows how to use System objects to do streaming signal processing in MATLAB®. The signals are read in and processed frame by frame (or block by block) in each processing loop. You can control the size of each frame.
In this example, frames of 1024 samples are filtered using a notch-peak filter in each processing loop. The input is a sine wave signal that is streamed frame by frame from a dsp.SineWave object. The filter is a notch-peak filter created using a dsp.NotchPeakFilter object. To ensure smooth processing as each frame is filtered, the System objects maintain the state of the filter from one frame to the next automatically.
In this example, frames of 1024 samples are filtered using a notch-peak filter in each processing loop. The input is a sine wave signal that is streamed frame by frame from a dsp.SineWave object. The filter is a notch-peak filter created using a dsp.NotchPeakFilter object. To ensure smooth processing as each frame is filtered, the System objects maintain the state of the filter from one frame to the next automatically.
Initialize Streaming Components
Initialize the sine wave source to generate the sine wave, the notch-peak filter to filter the sine wave, and the spectrum analyzer to show the filtered signal. The input sine wave has two frequencies: one at 100 Hz, and the other at 1000 Hz. Create two dsp.SineWave objects, one to generate the 100 Hz sine wave, and the other to generate the 1000 Hz sine wave.
Fs = 2500;
Sineobject1 = dsp.SineWave('SamplesPerFrame',1024,...
                     'SampleRate',Fs,'Frequency',100);
Sineobject2 = dsp.SineWave('SamplesPerFrame',1024,...
                     'SampleRate',Fs,'Frequency',1000);

SA = spectrumAnalyzer('SampleRate',Fs,...
    'Method','welch',...
    'AveragingMethod','exponential',...
    'ForgettingFactor',0.1,...
    'PlotAsTwoSidedSpectrum',false,...
    'ChannelNames',{'SinewaveInput','NotchOutput'},'ShowLegend',true);
Create Notch-Peak Filter
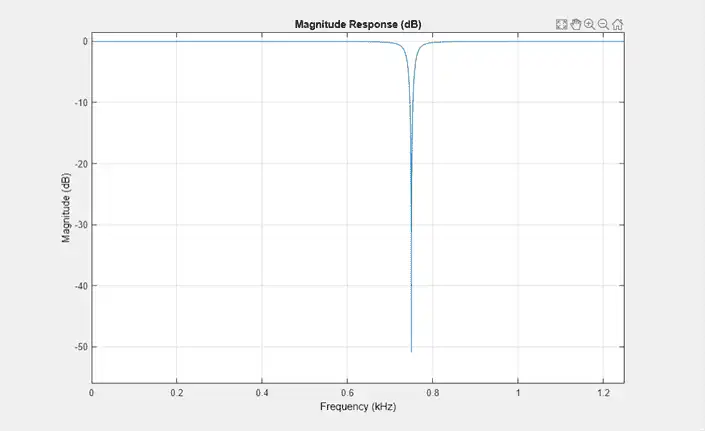
Create a second-order IIR notch-peak filter to filter the sine wave signal. The filter has a notch at 750 Hz and a Q-factor of 35. A higher Q-factor results in a narrower 3-dB bandwidth of the notch. If you tune the filter parameters during streaming, you can see the effect immediately in the spectrum analyzer output.
Wo = 750;
Q  = 35;
BW = Wo/Q;
NotchFilter = dsp.NotchPeakFilter('Bandwidth',BW,...
    'CenterFrequency',Wo, 'SampleRate',Fs);
fvtool(NotchFilter);
Stream In and Process Signal
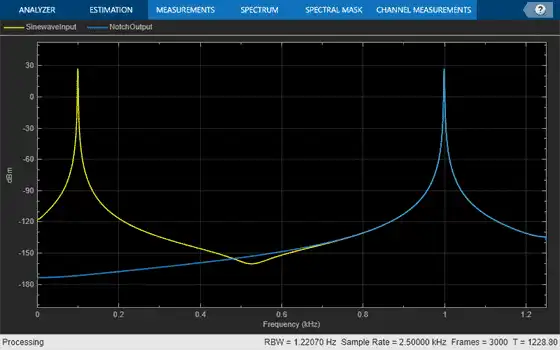
Construct a for-loop to run for 3000 iterations. In each iteration, stream in 1024 samples (one frame) of the sinewave and apply a notch filter on each frame of the input signal. To generate the input signal, add the two sine waves. The resultant signal is a sine wave with two frequencies: one at 100 Hz and the other at 1000 Hz. The notch of the filter is tuned to a frequency of 100, 500, 750, or 1000 Hz, based on the value of VecIndex. The filter bandwidth changes accordingly. When the filter parameters change during streaming, the output in the spectrum analyzer gets updated accordingly.
FreqVec = [100 500 750 1000];
VecIndex = 1;
VecElem = FreqVec(VecIndex);
for Iter = 1:3000
    Sinewave1 = Sineobject1();
    Sinewave2 = Sineobject2();
    Input = Sinewave1 + Sinewave2;
    if (mod(Iter,350)==0)
        if VecIndex < 4
            VecIndex = VecIndex+1;
        else
            VecIndex = 1;
        end
        VecElem = FreqVec(VecIndex);
    end
    NotchFilter.CenterFrequency = VecElem;
    NotchFilter.Bandwidth = NotchFilter.CenterFrequency/Q;
    Output = NotchFilter(Input);
    SA(Input,Output);
end
fvtool(NotchFilter)
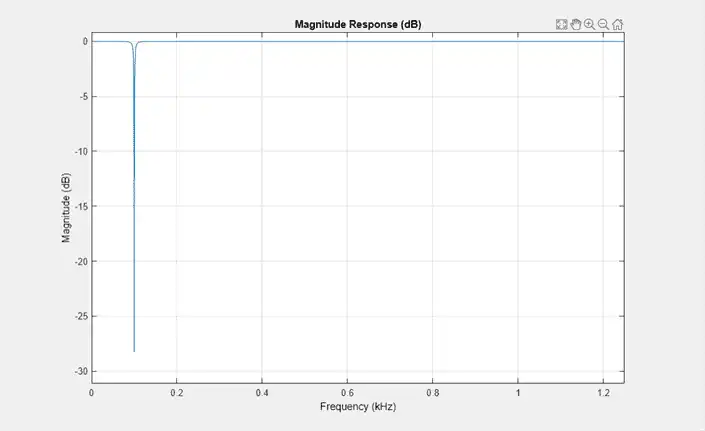
At the end of the processing loop, the CenterFrequency is at 100 Hz. In the filter output, the 100 Hz frequency is completely nulled out by the notch filter, while the frequency at 1000 Hz is unaffected.