Question
I keep getting error when I try to plot the following code and I don't really know what I'm doing wrong. data = readtable('instr_04_01.csv'); load = data.Extension(2:89); displacement = data.Load(2:89); figure plot(load, displacement) the error I keep getting is; Error using plot Not enough input arguments.
Expert Answer

Neeta Dsouza
PhD Expert
Answered Oct 12, 2026
You aren't extracting the numbers correctly. Also load is expecting arguments and you're giving it an equal sign instead of a filename. DO NOT USE A BUILT-IN FUNCTION FOR YOUR VARIABLE NAME.
Try this:
filename = 'instr_04_01.csv'
data = readtable('instr_04_01.csv', 'ReadVariableNames', true)
theLoad = str2double(data.Extension(2:end));
displacement = str2double(data.Load(2:end));
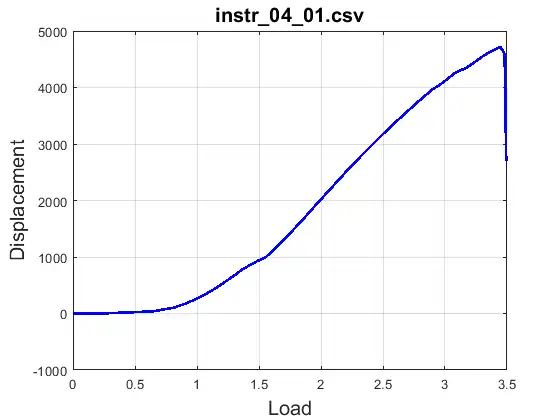
plot(theLoad, displacement, 'b-', 'LineWidth', 2)
grid on;
title(filename, 'FontSize', 15, 'Interpreter', 'none');
xlabel('Load', 'FontSize', 15);
ylabel('Displacement', 'FontSize', 15);
100% Run Guarantee
3-Hour Fast-Track Delivery
Need a Custom Version or Complete Simulation for This Problem?
Our 500+ PhD engineers build, debug, and optimize working MATLAB scripts and Simulink (.slx) models tailored to your exact assignment rubrics with zero plagiarism.
Tested on MATLAB R2024b / R2026a
Turnitin 0% Plagiarism Report
Free 7-Day Revisions Guarantee
Have a different question? Ask here
Related plot Questions & Solutions
Browse All →
Explore similar technical troubleshooting questions and verified MATLAB solutions:
Ready-to-Run MATLAB & Simulink Projects
Browse All Projects →