Question
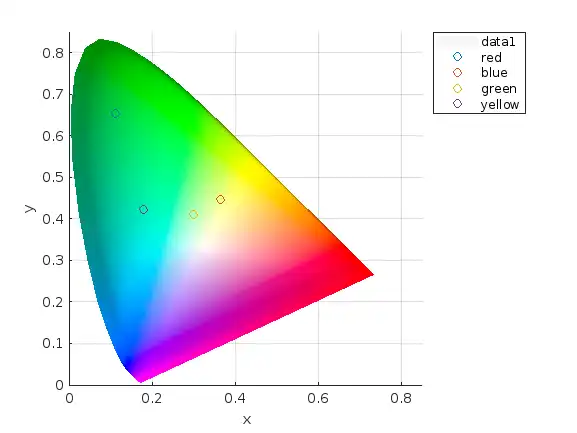
I have four points that I want to plot on CIE diagram. I am using the following command: plotChromaticity hold on scatter([x_1 x_2 x_3 x_4],[y_1 y_2 y_3 y_4]) hold off Now I want to add legend for these four points. For example: 'red', 'blue', 'green', and 'yellow'. How can I do that?
Related Questions
Expert Answer

Kshitij Singh
PhD Expert
Answered Aug 13, 2026
plotChromaticity

hold on

x = rand(1,4);

y=rand(1,4);
name =["red", "blue", "green", "yellow"]
name = 1×4 string array
    "red"    "blue"    "green"    "yellow"
for i=1:length(x)
    scatter(x(i), y(i),  'DisplayName', name(i));
end
hold off
legend
Have a different question? Ask here