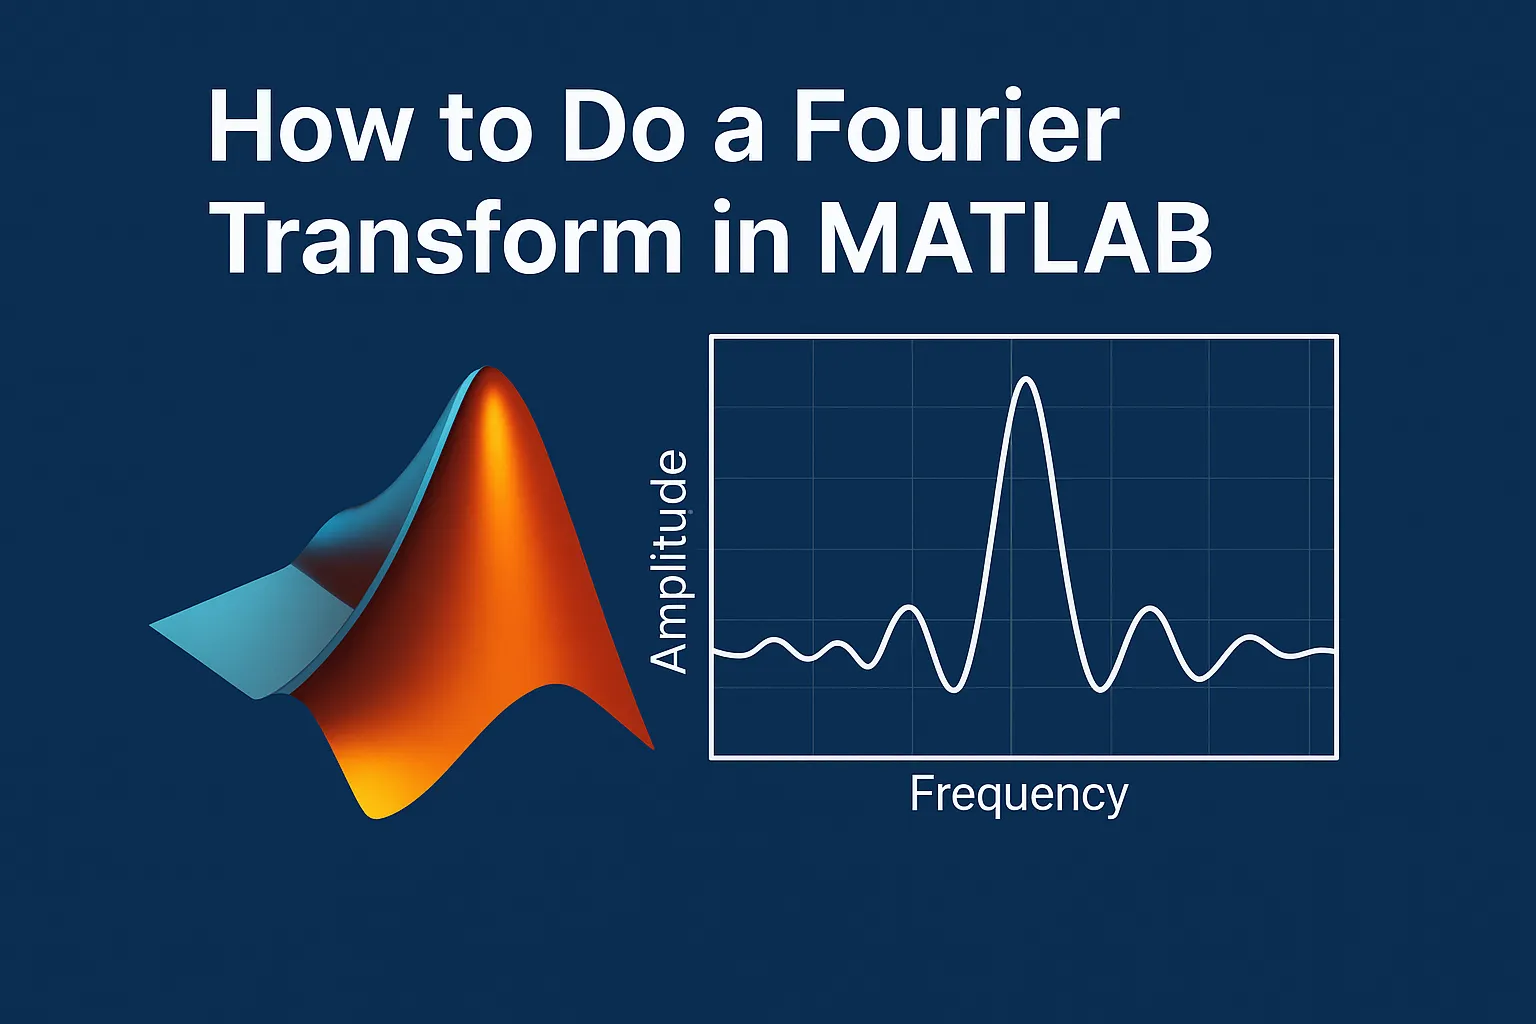
The Fourier Transform is one of the most powerful tools in signal processing. It allows you to convert a time-domain signal into its frequency components, helping you analyze patterns, filter noise, and understand signal behavior. MATLAB provides built-in functions that make performing Fourier Transforms easy and intuitive.
1. Understanding Fourier Transform
A Fourier Transform decomposes a signal into sine and cosine waves of different frequencies. The result shows how much of each frequency is present in the original signal.
-
Time Domain: Signal as it varies with time.
-
Frequency Domain: Signal represented as amplitudes vs frequencies.
In MATLAB, the Fast Fourier Transform (FFT) is commonly used for discrete signals.
Explanation:
-
fft(signal)computes the discrete Fourier Transform. -
P1gives the single-sided amplitude spectrum. -
The plot shows which frequencies dominate the signal.
3. Tips for Accurate FFT in MATLAB
-
Sampling frequency (Fs): Must be at least twice the highest frequency (Nyquist criterion).
-
Windowing: Apply windows like Hamming or Hann to reduce spectral leakage.
-
Zero-padding: Improves frequency resolution without adding information.
-
Noise reduction: Preprocess the signal to remove unwanted noise.
4. Applications
Fourier Transform in MATLAB is widely used in:
-
Audio and speech processing
-
Vibration analysis
-
Image processing
-
Electrical signal analysis
-
Communication systems
Conclusion
Performing a Fourier Transform in MATLAB is straightforward with the fft function. By converting signals from the time domain to the frequency domain, you can gain deep insights into signal behavior, filter noise, and design systems efficiently. With practice, FFT becomes an essential tool for engineers, scientists, and students working with signals.
Executable MATLAB Script & Model Setup
% Define time vector
 Fs = 1000;             % Sampling frequency (Hz)
 T = 1/Fs;              % Sampling period
 L = 1000;              % Length of signal
 t = (0:L-1)*T;         % Time vector

 % Create a sample signal (sine wave + noise)
 f1 = 50;               % Frequency of sine wave
 signal = 0.7*sin(2*pi*f1*t) + 0.5*randn(size(t));

 % Perform Fourier Transform
 Y = fft(signal);

 % Compute two-sided spectrum
 P2 = abs(Y/L);

 % Compute single-sided spectrum
 P1 = P2(1:L/2+1);
 P1(2:end-1) = 2*P1(2:end-1);

 % Define frequency domain
 f = Fs*(0:(L/2))/L;

 % Plot frequency spectrum
 figure;
 plot(f, P1)
 title('Single-Sided Amplitude Spectrum of Signal')
 xlabel('Frequency (Hz)')
ylabel('|P1(f)|')Related Verified MATLAB & Simulink Projects
Need pre-built, debugged Simulink models with complete parameter initialization scripts and documentation? Explore top related solutions:
Common Engineering Troubleshooting & Q&A
Frequently encountered bugs, solver convergence issues, and implementation questions answered by our engineering mentors:
Recommended Engineering Articles
Need Custom MATLAB / Simulink Implementation?
Our team of PhD engineers build custom simulation plants, train machine learning agents, tune PID/MPC controllers, and deliver complete, executable code with Turnitin reports.